xinian70
CROC Analista
Il TS ADX/ADM
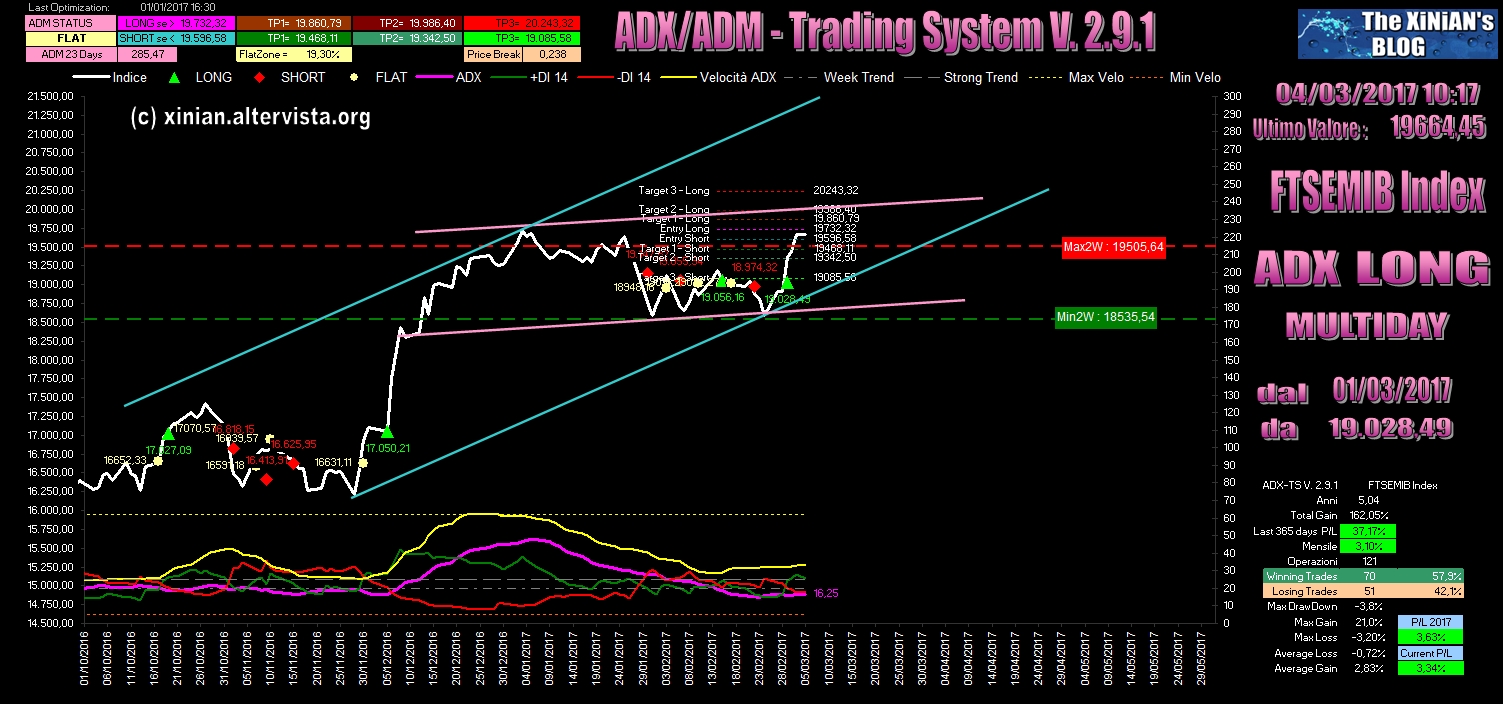
L’ADX o Average Directional Index
è un ottimo indicatore di medio periodo però
indica solo la forza del trend e non la sua direzione.
Il valore dell’ADX può essere compreso tra 0 e 100. Tipicamente un trend caratterizzato da un ADX al di sotto del 20 è considerato debole, mentre sopra 25 è da considerarsi forte.
Molto più utili gli indicatori +DI (Positive Directional Indicator) ed il -DI (Negative Directional Indicator), considerando la loro media a 14 giorni: +DI14 in verde e -DI14 in rosso.
I loro incroci deteminano la la direzione del trend.
+DI14 > -DI14+FlatZone = LONG
+DI14 < -DI14-Flatzone = SHORT
FLAT nella fascia -Flatzone+Flatzone dell'incrocio
la Flatzone era -10% +10% nelle vecchie versioni , ora è calcolata anche essa in base a dei backtest periodici
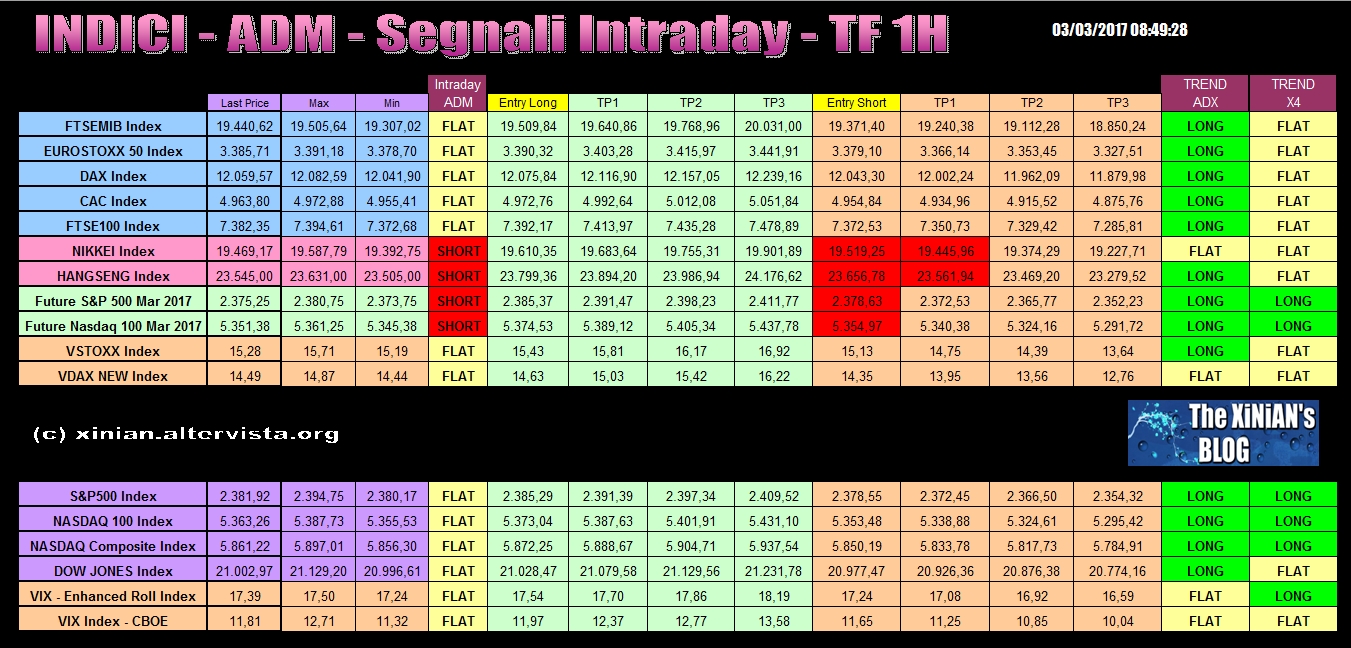
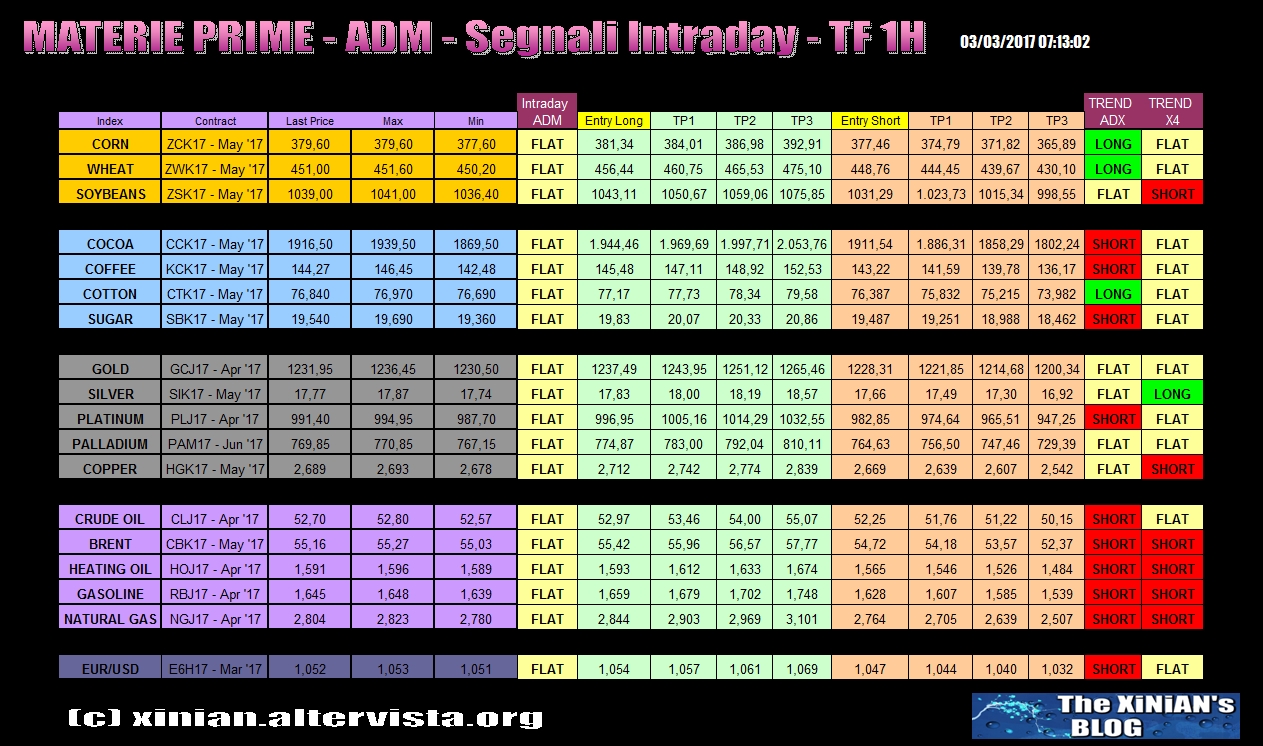
L'ADM o Average Daily Movement è un indicatore Intraday basato sulla volatilità
vengono dati ogni giorno 2 entry (Long o Short) e 3 Take Profit (Long e Short)

Operativamente:
si entra long/short se alla chiusura oraria (alle 10, alle 11, ecc) il valore dell’indice è superiore/inferiore all’entry long/short giornaliero
poi
se non arriva il TP xx entro chiusura
se siamo in trend (vedi ADX) si va in over e il giorno dopo si chiude se entra il segnale di reverse
se siamo controtrend (ADX contrario) si chiude in chiusura mercato
per esempio…
al segnale io entro long con 3 posizioni (3 contratti, ecc…)
la 1° pos va in take profit sul TP1 (alla battuta)
la 2° sul TP2 (alla battuta) una volta fatto il TP1 (candela oraria) si alza lo stop loss sull’entry
la 3° sul TP3 (alla battuta) una volta fatto il TP2 (candela oraria) si alza lo stop loss sul TP1
- se ADX è FLAT o LONG, se non ha raggiunto uno dei target si porta la posizione in over…..
il giorno dopo al raggiungimento del TP1 si vendono tutte le posizioni e si aspettano i segnali nuovi, se invece non arriva l’ex-tp1 ma entra l’entry contraria si chiude tutto e si reversa.
- se ADX è SHORT meglio chiuderla in giornata
Varianti intraday
i livelli sono da considerare come resistenze/supporti
una volta superata una resistenza diventa supporto, e viceversa….
per esempio il 21/04/2015

ha fatto
1 – entry long
2 – entry short (stop loss & reverse)
3 – tp1 short
4 – ex-entry short (nuovo entry long)
5 – ex-entry long (nuovo tp1 long)
Calcolo dei livelli intraday
ADM è la media su N-giorni della volatilità giornaliera (Max-Min) , la media a N giorni…
io ora lo calcolo periodicamente in base a dei backtest e lo trovate in alto a sinistra nel grafico , nelle prime versioni del TS usavo il valore di 30 giorni, che è abbastanza valido
,altri usano altri valori..
i livelli di entrata vengono calcolati in questo modo
i livelli di entrata vengono calcolati in questo modo:
la teoria standard dice di usare un break-out level = 0.382 (Price Break) , io ultimamente lo sto calcolando ogni giorno in base alla volatilità
(chiusura giorno precedente + Price Break*ADM Ndays) ci dà l’Entry Long
(chiusura giorno precedente – Price Break*ADM Ndays) ci dà l’Entry Short
DayC = chiusura giorno precedente
C = prezzo corrente
Entry Long = C>((DayC)+((Price Break)*(ADM Ndays)));
Entry Short = C<((DayC)-((Price Break*(ADM Ndays)));
ho notato che però quando aumenta la volatilità il price break posto a 0,382 genera diversi falsi segnali
pertanto dalla versione 3.0 sto sperimentando questa formula…
Price Break=(0,382+0,382*((ADM 10 days-ADM Ndays)/ADM Ndays))
I target invece vengono così calcolati….
Target 1 Long = (0.45*ADM)+Entry Long;
Target 2 Long = (0.95*ADM)+Entry Long;
Target 3 Long = (1.95*ADM)+Entry Long;
Target 1 Short = Entry Short-(0.45*ADM);
Target 2 Short = Entry Short-(0.95*ADM);
Target 3 Short = Entry Short-(1.95*ADM);
-----------------------------------------------------------------------------------
Implementazioni su piattaforme Standard:
ADM v. 2. 0 per Amibroker by Murali krishna
http://www.wisestocktrader.com/indicators/4059-ultimate-volatility-trading-system-v-2.txt
ADM per VisualTrader by Strong
ADM by Strong. (Modificato da Webb Ellis Settembre 2015)
ADM per ProrealTime by domedome61
ADM per ProrealTime - TimeFrame Orario - by domedome61
ADM per Tradingview by aldebaran74
ADM per T3 Webank by Swing64
-----------------------------------------------------------------------------------
Il TS di medio-lungo periodo (X4)
il CMX o Complex Momentum Index
il CMX o Complex Momentum Index, è un indicatore proprietario che analizza le proprietà fisiche delle armoniche che compongono l’andamento dell’indice.
La formula al momento è segreta.
Rappresenta in un “certo modo” l’andamento ombra dell’indice..

quando CMX supera la linea dello 0 da sotto a sopra l’indice riceve un impulso long (freccia azzurra verso l’alto)
quando CMX supera la linea dello 0 da sopra a sotto l’indice riceve un impulso short (freccia fucsia verso il basso)
Per le inversioni si usa accoppiato all’ X+4 (Ciclo Ombra di medio-lungo periodo)

quando CMX supera verso l’alto X+4 del 15% inversione long di medio-lungo periodo (freccia verde verso l’alto)
tra -15% e + 15% è FLAT (cerchio o elisse color giallo chiaro)
quando CMX supera verso il basso X+4 del 15% inversione short di medio-lungo periodo (freccia rossa verso il basso)
---------------------------------------------------------------------------------------------------------------------------------------------------------------------------------------------------[/URL]
L’ADX o Average Directional Index
è un ottimo indicatore di medio periodo però
indica solo la forza del trend e non la sua direzione.
Il valore dell’ADX può essere compreso tra 0 e 100. Tipicamente un trend caratterizzato da un ADX al di sotto del 20 è considerato debole, mentre sopra 25 è da considerarsi forte.
Molto più utili gli indicatori +DI (Positive Directional Indicator) ed il -DI (Negative Directional Indicator), considerando la loro media a 14 giorni: +DI14 in verde e -DI14 in rosso.
I loro incroci deteminano la la direzione del trend.
+DI14 > -DI14+FlatZone = LONG
+DI14 < -DI14-Flatzone = SHORT
FLAT nella fascia -Flatzone+Flatzone dell'incrocio
la Flatzone era -10% +10% nelle vecchie versioni , ora è calcolata anche essa in base a dei backtest periodici
L'ADM o Average Daily Movement è un indicatore Intraday basato sulla volatilità
vengono dati ogni giorno 2 entry (Long o Short) e 3 Take Profit (Long e Short)
Operativamente:
si entra long/short se alla chiusura oraria (alle 10, alle 11, ecc) il valore dell’indice è superiore/inferiore all’entry long/short giornaliero
poi
se non arriva il TP xx entro chiusura
se siamo in trend (vedi ADX) si va in over e il giorno dopo si chiude se entra il segnale di reverse
se siamo controtrend (ADX contrario) si chiude in chiusura mercato
per esempio…
al segnale io entro long con 3 posizioni (3 contratti, ecc…)
la 1° pos va in take profit sul TP1 (alla battuta)
la 2° sul TP2 (alla battuta) una volta fatto il TP1 (candela oraria) si alza lo stop loss sull’entry
la 3° sul TP3 (alla battuta) una volta fatto il TP2 (candela oraria) si alza lo stop loss sul TP1
- se ADX è FLAT o LONG, se non ha raggiunto uno dei target si porta la posizione in over…..
il giorno dopo al raggiungimento del TP1 si vendono tutte le posizioni e si aspettano i segnali nuovi, se invece non arriva l’ex-tp1 ma entra l’entry contraria si chiude tutto e si reversa.
- se ADX è SHORT meglio chiuderla in giornata
Varianti intraday
i livelli sono da considerare come resistenze/supporti
una volta superata una resistenza diventa supporto, e viceversa….
per esempio il 21/04/2015
ha fatto
1 – entry long
2 – entry short (stop loss & reverse)
3 – tp1 short
4 – ex-entry short (nuovo entry long)
5 – ex-entry long (nuovo tp1 long)
Calcolo dei livelli intraday
ADM è la media su N-giorni della volatilità giornaliera (Max-Min) , la media a N giorni…
io ora lo calcolo periodicamente in base a dei backtest e lo trovate in alto a sinistra nel grafico , nelle prime versioni del TS usavo il valore di 30 giorni, che è abbastanza valido
,altri usano altri valori..
i livelli di entrata vengono calcolati in questo modo
i livelli di entrata vengono calcolati in questo modo:
la teoria standard dice di usare un break-out level = 0.382 (Price Break) , io ultimamente lo sto calcolando ogni giorno in base alla volatilità
(chiusura giorno precedente + Price Break*ADM Ndays) ci dà l’Entry Long
(chiusura giorno precedente – Price Break*ADM Ndays) ci dà l’Entry Short
DayC = chiusura giorno precedente
C = prezzo corrente
Entry Long = C>((DayC)+((Price Break)*(ADM Ndays)));
Entry Short = C<((DayC)-((Price Break*(ADM Ndays)));
ho notato che però quando aumenta la volatilità il price break posto a 0,382 genera diversi falsi segnali
pertanto dalla versione 3.0 sto sperimentando questa formula…
Price Break=(0,382+0,382*((ADM 10 days-ADM Ndays)/ADM Ndays))
I target invece vengono così calcolati….
Target 1 Long = (0.45*ADM)+Entry Long;
Target 2 Long = (0.95*ADM)+Entry Long;
Target 3 Long = (1.95*ADM)+Entry Long;
Target 1 Short = Entry Short-(0.45*ADM);
Target 2 Short = Entry Short-(0.95*ADM);
Target 3 Short = Entry Short-(1.95*ADM);
-----------------------------------------------------------------------------------
Implementazioni su piattaforme Standard:
ADM v. 2. 0 per Amibroker by Murali krishna
http://www.wisestocktrader.com/indicators/4059-ultimate-volatility-trading-system-v-2.txt
ADM per VisualTrader by Strong
Codice:
{******************************************************************************
* ADM by Strong.
*
* Versione 1 fix 1 del 18/04/2014
*
* Filtro ingressi ATTIVO
*
******************************************************************************}

Var:
newDay(false), // CAMBIO GIORNO
numDay(0),     // STORICO GIORNI PER CALCOLO ADM
lastRange,lastClose,HistoryRange,HistoryClose, // VALORI END OF DAY
num(0),den(0),adm(0),STORICO_ADM(30), // ADM
targetLong(0),targetShort(0), // TARGET X USCITA
stopLossLong(0),stopLossShort(0), // STOPLOSS
flagLong(false),flagShort(false),   // SINGOLA OPERAZIONE GIORNALIERA
buf, // TEMPORANEA
zonaPlotting;

//
// ************************ CALCOLO INDICATORE ADM *****************************
//
newDay=GetValues (days, 1, buf,buf,buf,buf);
if newDay then

  // FLAG PER GESTIRE UNA OPERAZIONE LONG E SHORT AL GIORNO
  flagLong=true;
  flagShort=true;

  lastRange=EOD.R[1];
  lastClose=EOD.C[1];

  num = num + lastRange*lastClose;
  den = den + lastClose;

  // GESTIONE DEL NUMERO DI GIORNI PER IL CALCOLO DELL'INDICATORE
  if numDay >= STORICO_ADM then

    historyRange=EOD.R[STORICO_ADM];
    historyClose=EOD.C[STORICO_ADM];
    num = num - historyRange*historyClose;
    den = den - historyClose;

  endif;

  // CALCOLO ADM
  adm = num/den;

  inc(numDay);

endif;

//
// ************************ LONG ***********************************************
//
if LastBar = false and adm > 0 and flagLong and positionlong = false then

   // FILTRO SUGLI INGRESSI
   //   if (C>H[1] or B[1]) and W and  C > lastclose+ (0.382*adm) then
   if (C > lastclose + (0.5*adm)) then
   //   if C > C[1]+ (0.382*adm) then
     colorbar(green);
      // CancelExitLong("target 0.5");
     enterlong(nextBar,atopen);
     stopLossLong = 0.5 * adm;
     targetLong = adm * 0.5;
     flagLong = false;
    endif;

endif;

SECTION_EXITLONG:

  // STOPLOSS DINAMICO
  //exitlong(NextBar,positionvaluethisbar + targetLong , limit, 3 , "Target 0.5");

  // STOPLOSS STATICO
  //  if C < positionvaluethisbar - stopLossLong then

    //exitlong(nextbar,atopen);
  //endif;

  // USCITA A FINE GIORNATA
  //if t = 1700 then
  //  exitlong(bar,atclose);
  //endif;

END_SECTION


//
// ************************ SHORT **********************************************
//
if LastBar = false and adm > 0 and flagShort < 1 and positionshort = false then

   // FILTRO SUGLI INGRESSI
    //   if (C < L[1] or W[1]) and B and C < lastclose - (0.382*adm) then
    if (C < lastclose - (0.5*adm)) then
    //if  C < C[1] - (0.382*adm) then

     colorbar(red);

      //CancelExitshort("Target 0.5");
     entershort(nextBar,atopen);

     stopLossShort = 0.5 * adm;
     targetShort = adm * 0.5;

     flagSHort=false;

   endif;

endif;

SECTION_EXITSHORT:

  //STOPLOSS DINAMICO
  // exitshort(NextBar, positionvaluethisbar - targetShort, limit, 3, "Target 0.5");

  //STOPLOSS STATICO
  //if C > positionvaluethisbar + stopLossShort then
    //exitshort(nextbar,atopen);
  //endif;

  // USCITA A FINE GIORNATA
  //if t = 1700 then
  //  exitshort(bar,atclose);
  //endif;

END_SECTION


//
// ************************ PLOTTING *******************************************
//

// DISEGNA  I VALORI DI INGRESSO SUL GRAFICO PRINCIPALE
PlotChart(lastclose + adm*0.5 , 0, lime, solid, 1);
PlotChart(lastclose - adm*0.5 , 0, red, solid, 1);

PlotChart(lastclose + adm*0.5 + adm*0.45 , 0, green, Dot, 1);
PlotChart(lastclose - adm*0.5 - adm*0.45 , 0, fuchsia, Dot, 1);

PlotChart(lastclose + adm*0.5 + adm*0.95 , 0, green, Dot, 1);
PlotChart(lastclose - adm*0.5 - adm*0.95 , 0, fuchsia, Dot, 1);

PlotChart(lastclose + adm*0.5 + adm*1.95 , 0, green, Dot, 1);
PlotChart(lastclose - adm*0.5 - adm*0.95 , 0, fuchsia, Dot, 1);

// CREA AREA DI PLOTTING
//zonaPlotting = CreateViewport(200, true, true);

// DISEGNA  I VALORI DI CALCOLO SULLA AREA DI PLOTTING (FACOLTATIVO)
//PlotChart(historyRange, zonaPlotting, blue, solid, 1);
//PlotChart(lastRange, zonaPlotting, red, solid, 1);
ADM by Strong. (Modificato da Webb Ellis Settembre 2015)
Codice:
{*************************************** ***************************************
* ADM by Strong. (Modificato da Webb Ellis Settembre 2015)
*
* Versione 1 fix 1 del 18/04/2014
*
* Filtro ingressi ATTIVO
*
**************************************** **************************************}

Var:
newDay(false), // CAMBIO GIORNO
numDay(0), numDay10(0), // STORICO GIORNI PER CALCOLO ADM
lastRange,lastClose,HistoryRange,History Close,historyrange10,historyclose10, // VALORI END OF DAY
num(0),num10(0),den(0),den10(0),adm(0),S TORICO_ADM(26), ADM10(10),DIF(0),
PRICEBREAK(0),pricebreak1(0), // ADM
targetLong(0),targetShort(0), // TARGET X USCITA
stopLossLong(0),stopLossShort(0), // STOPLOSS
flagLong(false),flagShort(false), // SINGOLA OPERAZIONE GIORNALIERA
buf, // TEMPORANEA
zonaPlotting;

//
// ************************ CALCOLO INDICATORE ADM *****************************
//
// AGGIUNGO CALCOLO PRICEBREAK


newDay=GetValues (days, 1, buf,buf,buf,buf);
if newDay then

// FLAG PER GESTIRE UNA OPERAZIONE LONG E SHORT AL GIORNO
flagLong=true;
flagShort=true;

lastRange=EOD.R[1];
lastClose=EOD.C[1];

num = num + lastRange*lastClose;
den = den + lastClose;

num10 = num10 + lastRange*lastClose;
den10 = den10 + lastClose;


// GESTIONE DEL NUMERO DI GIORNI PER IL CALCOLO DELL'INDICATORE
if numDay >= STORICO_ADM then

historyRange=EOD.R[STORICO_ADM]; //adm 26 gg
historyClose=EOD.C[STORICO_ADM];
num = num - historyRange*historyClose;
den = den - historyClose;

endif;

// CALCOLO ADM
adm = num/den;

inc(numDay);


// GESTIONE DEL NUMERO DI GIORNI PER IL CALCOLO DELL'INDICATORE da 10gg
if numDay10 >= adm10 then

historyRange10=EOD.R[adm10]; //adm 10gg
historyClose10=EOD.C[adm10];
num10 = num10 - historyRange10*historyClose10;
den10 = den10 - historyClose10;

endif;

// CALCOLO ADM
adm10 = num10/den10;

inc(numDay10);
Pricebreak = 0.266+(0.266*(adm10-adm)/adm); //per long
Pricebreak1 = 0.382+(0.382*(adm10-adm)/adm); // per short
endif;


//
// ************************ LONG **************************************** *******
//
if LastBar = false and adm > 0 and flagLong and positionlong = false then

// FILTRO SUGLI INGRESSI
// if (C>H[1] or B[1]) and W and C > lastclose+ (0.382*adm) then
//if (C > lastclose + (0.5*adm)) then
// if C > C[1]+ (0.382*adm) then
if (C > lastclose + (pricebreak*adm))
and (t>0959) // si entra dalle 10 in poi
// and (C<lastclose + adm*pricebreak + adm*0.45) //minore del TP1
and C>C[1] then //in crescendo
colorbar(green);
// CancelExitLong("target 0.5");
enterlong(nextBar,atopen);
stopLossLong = 0.5 * adm;
targetLong = adm * 0.5;
flagLong = false;
endif;

endif;

SECTION_EXITLONG:

// STOPLOSS DINAMICO
//exitlong(NextBar,positionvaluethisbar + targetLong , limit, 3 , "Target 0.5");

// STOPLOSS STATICO
// if C < positionvaluethisbar - stopLossLong then

//exitlong(nextbar,atopen);
//endif;

// USCITA A FINE GIORNATA
//if t = 1700 then
// exitlong(bar,atclose);
// endif;

// if C > (lastclose + adm*0.266 + adm*0.95) then //uscita al TP2
// exitlong(bar,atclose);
// endif;
END_SECTION


//
// ************************ SHORT **************************************** ******
//
if LastBar = false and adm > 0 and flagShort < 1 and positionshort = false then

// FILTRO SUGLI INGRESSI
// if (C < L[1] or W[1]) and B and C < lastclose - (0.382*adm) then
//if (C < lastclose - (0.5*adm)) then
//if C < C[1] - (0.382*adm) then
if (C < lastclose - (pricebreak1*adm))
and (t>0959) //oltre le 10
//and (C>(lastclose - adm*pricebreak1 - adm*0.45)) //maggiore del tp1
and C<C[1] then // in decrescita
colorbar(red);

//CancelExitshort("Target 0.5");
entershort(nextBar,atopen);

stopLossShort = 0.5 * adm;
targetShort = adm * 0.5;

flagSHort=false;

endif;

endif;

SECTION_EXITSHORT:

//STOPLOSS DINAMICO
// exitshort(NextBar, positionvaluethisbar - targetShort, limit, 3, "Target 0.5");

//STOPLOSS STATICO
//if C > positionvaluethisbar + stopLossShort then
//exitshort(nextbar,atopen);
//endif;

// USCITA A FINE GIORNATA
//if t = 1700 then
// exitshort(bar,atclose);
//endif;
// uscita per TP1
//if C < (lastclose - adm*0.266 - adm*0.95) then //uscita al TP2
// exitshort(bar,atclose);
// endif;

END_SECTION


//
// ************************ PLOTTING **************************************** ***
//

// DISEGNA I VALORI DI INGRESSO SUL GRAFICO PRINCIPALE
PlotChart(lastclose + adm*pricebreak, 0, lime, solid, 1);
PlotChart(lastclose - adm*pricebreak1, 0, red, solid, 1);

PlotChart(lastclose + adm*pricebreak + adm*0.45 , 0, green, Dot, 1);
PlotChart(lastclose - adm*pricebreak1 - adm*0.45 , 0, fuchsia, Dot, 1);

PlotChart(lastclose + adm*pricebreak + adm*0.95 , 0, green, Dot, 1);
PlotChart(lastclose - adm*pricebreak1 - adm*0.95 , 0, fuchsia, Dot, 1);

PlotChart(lastclose + adm*pricebreak + adm*1.95 , 0, green, Dot, 1);
PlotChart(lastclose - adm*pricebreak1 - adm*1.95 , 0, fuchsia, Dot, 1);

// CREA AREA DI PLOTTING
//zonaPlotting = CreateViewport(200, true, true);

// DISEGNA I VALORI DI CALCOLO SULLA AREA DI PLOTTING (FACOLTATIVO)
//PlotChart(historyRange, zonaPlotting, blue, solid, 1);
//PlotChart(lastRange, zonaPlotting, red, solid, 1);
ADM per ProrealTime by domedome61
Codice:
admn=((high[26]-low[26])+(high[25]-low[25])+(high[24]-low[24])+(high[23]-low[23])+(high[22]-low[22])+(high[21]-low[21])+(high[20]-low[20])+(high[19]-low[19])+(high[18]-low[18])+(high[17]-low[17])+(high[16]-low[16])+(high[15]-low[15])+(high[14]-low[14])+(high[13]-low[13])+(high[12]-low[12])+(high[11]-low[11])+(high[10]-low[10])+(high[9]-low[9])+(high[8]-low[8])+(high[7]-low[7])+(high[6]-low[6])+(high[5]-low[5])+(high[4]-low[4])+(high[3]-low[3])+(high[2]-low[2])+(high[1]-low[1]))/26
El=(close[1]+(0.266*admn))
es=(close[1]-(0.266*admn))
el1=((0.45*admn)+el)
el2=((0.95*admn)+el)
el3=((1.95*admn)+el)
es1=(es-(0.45*admn))
es2=(es-(0.95*admn))
es3=(es-(1.95*admn))


RETURN el ,es,el1,el2,el3,es1,es2,es3
ADM per ProrealTime - TimeFrame Orario - by domedome61
Codice:
AAA=(DHigh(1)-DLow(1))
admn=(AAA[26]+(AAA)[25]+(AAA)[24]+(AAA)[23]+(AAA)[22]+(AAA)[21]+(AAA)[20]+(AAA)[19]+(AAA)[18]+(AAA)[17]+(AAA)[16]+(AAA)[15]+(AAA)[14]+(AAA)[13]+(AAA)[12]+(AAA)[11]+(AAA)[10]+(AAA)[9]+(AAA)[8]+(AAA)[7]+(AAA)[6]+(AAA)[5]+(AAA)[4]+(AAA)[3]+(AAA)[2]+(AAA)[1])/26
AAB=(DCLOSE(1))
El=(AAB+(0.266*admn))
es=(AAB-(0.266*admn))
el1=((0.45*admn)+el)
el2=((0.95*admn)+el)
el3=((1.95*admn)+el)
es1=(es-(0.45*admn))
es2=(es-(0.95*admn))
es3=(es-(1.95*admn))


RETURN el,es,el1,el2,el3,es1,es2,es3
ADM per Tradingview by aldebaran74
Codice:
study("Adm", overlay=true)
gg = input(title="Giorni", type=integer, defval=26, minval=1)
bg = input(title="Barre al giorno", type=integer, defval=9, minval=1)
pb = input(title="Price break", type=float, defval=0.266, minval=0.1)

barre = gg*bg
newbar =  change(time("D")) != 0 ? 1 : 0
adm = (sum ((security(tickerid, "D", high[1])-security(tickerid, "D", low[1]))*newbar, barre)) / gg
//non ho ancora trovato un metodo migiore per far capire che serve un valore per ogni giorno
chiusuraieri = security(tickerid, "D", close[1])
compra = chiusuraieri + adm*pb
vendi = chiusuraieri - adm*pb
plot (compra, color=green, title="LONG", linewidth=2)
plot (vendi, color=red, title="SHORT", linewidth=2)
plot (compra+(0.45*adm), color=green, title='tg1')
plot (compra+(0.95*adm), color=green, title='tg2')
plot (compra+(1.95*adm), color=green, title='tg3')
plot (vendi-(0.45*adm), color=red, title='tg1')
plot (vendi-(0.95*adm), color=red, title='tg2')
plot (vendi-(1.95*adm), color=red, title='tg3')
ADM per T3 Webank by Swing64
Codice:
//periodo = 26

ranges = 0
for i = 1 to periodo
ranges = ranges + (dhigh(i)-dlow(i))
next
ADM=ranges/periodo

EntryShort = dclose(1) - ADM*0.266
TS1 = EntryShort-0.45*ADM
TS2 = EntryShort-0.95*ADM
TS3 = EntryShort-1.95*ADM

EntryLong = dclose(1) + ADM*0.266
TL1 = EntryLong+0.45*ADM
TL2 = EntryLong+0.95*ADM
TL3 = EntryLong+1.95*ADM

return TL3 AS "Long3", TL2 AS "Long2", TL1 AS "Long1",EntryLong AS "Entry Long",EntryShort AS "Entry Short",TS1 AS "Short1",TS2 AS "Short2",TS3 AS "Short3"Il TS di medio-lungo periodo (X4)
il CMX o Complex Momentum Index
il CMX o Complex Momentum Index, è un indicatore proprietario che analizza le proprietà fisiche delle armoniche che compongono l’andamento dell’indice.
La formula al momento è segreta.
Rappresenta in un “certo modo” l’andamento ombra dell’indice..
quando CMX supera la linea dello 0 da sotto a sopra l’indice riceve un impulso long (freccia azzurra verso l’alto)
quando CMX supera la linea dello 0 da sopra a sotto l’indice riceve un impulso short (freccia fucsia verso il basso)
Per le inversioni si usa accoppiato all’ X+4 (Ciclo Ombra di medio-lungo periodo)
quando CMX supera verso l’alto X+4 del 15% inversione long di medio-lungo periodo (freccia verde verso l’alto)
tra -15% e + 15% è FLAT (cerchio o elisse color giallo chiaro)
quando CMX supera verso il basso X+4 del 15% inversione short di medio-lungo periodo (freccia rossa verso il basso)
---------------------------------------------------------------------------------------------------------------------------------------------------------------------------------------------------[/URL]
Ultima modifica:
")