lungo, ma interessante. un pezzettino:
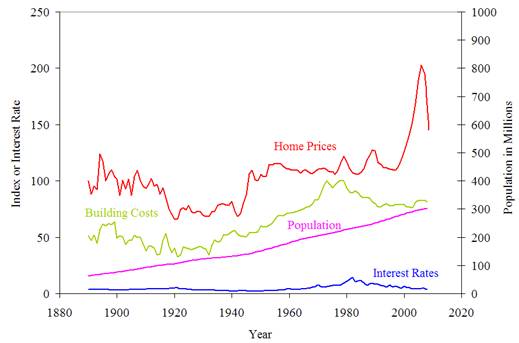
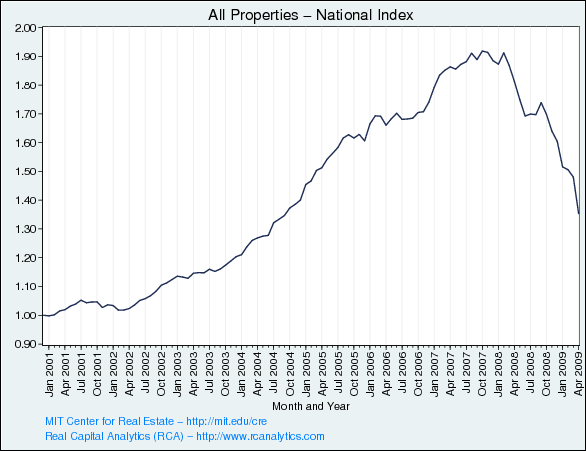
As soon as we can stabilize housing, all of our troubles will be solved. This is the mantra we hear night after night on CNBC. The chart below unmistakably paints an abnormal picture of home prices. Karl Case, an economics professor at Wellesley College whose name adorns the S&P Case-Shiller home-price indexes, has studied U.S. house prices going back to the 1890s. Over the long run, he says, home prices tend to increase on average at an inflation-adjusted rate of 2.5% to 3% a year, about the same as per capita income.

The American population has steadily increased from 100 million to 300 million over the last 120 years. Home prices gained at an uneven rate from 1890 until 2000. Then the combination of bubble boy Alan Greenspan, Harvard MBA George Bush, delusional home buyers, criminal investment bankers, pizza delivery boys turned mortgage brokers, and blind regulators led to the greatest bubble in history. Prices doubled in many places in six years versus a 15% expected historical return.

Prices have now declined back within the range seen during the period from the 1970s through the 1990s. This is why the eternal optimists are proclaiming a housing bottom. These people don’t seem to understand the concept of averages. An average is created by prices being above average for a period of time and then below average for a period of time. The current downturn will over correct to the downside. The most respected housing expert on the planet, Robert Shiller, recently gave his opinion on the future of our housing market:

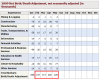
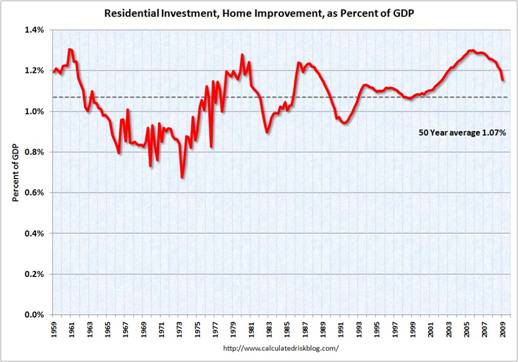
Residential investment and home improvement expenditures have averaged 1.07% of GDP over the last 50 years. This is the 4th time it has peaked above 1.2%. After the three previous peaks it bottomed below 1%. Based on history, it will bottom out at .8% in the middle of the next decade. This would be a reduction of $70 billion in housing investment from the peak. Great news for Home Depot and Lowes.
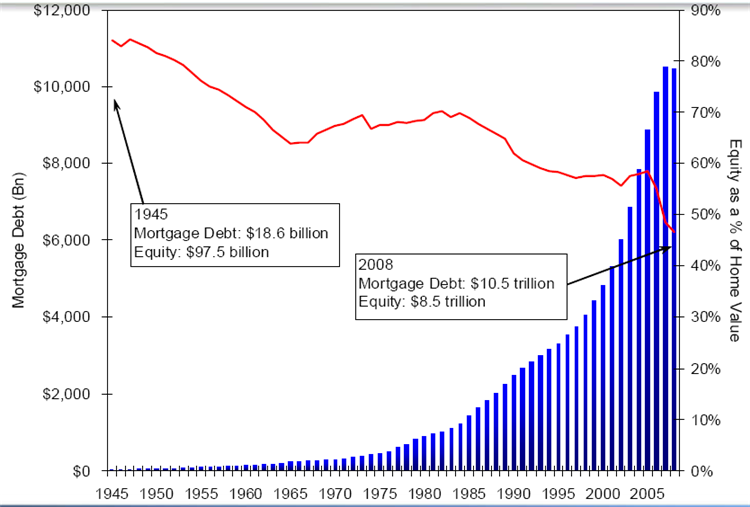
A housing rebound is a virtual impossibility based on any honest assessment of the facts. Homeowners currently have the least amount of equity in their homes on record. Real-estate Web site Zillow.com said that overall, the number of borrowers who are underwater climbed to 20.4 million at the end of the first quarter from 16.3 million at the end of the fourth quarter. The latest figure represents 21.9% of all homeowners, according to Zillow, up from 17.6% in the fourth quarter and 14.3% in the third quarter. There are 75 million homes in the United States. One third of homeowners have no mortgage, so that means that 41% of all homeowners with a mortgage are underwater. With prices destined for another 10% to 20% drop, the number of underwater borrowers will reach 25 million.
MORTGAGE DEBT

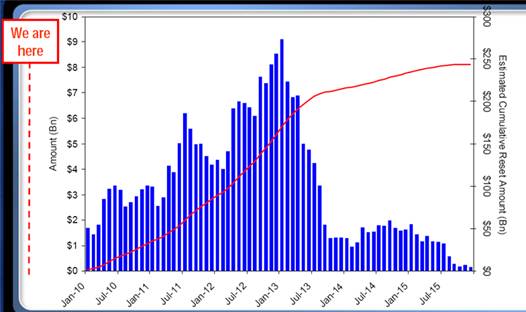
There are over 4 million homes for sale in the U.S. today. This is about one year’s worth of inventory at current sales levels. You can be sure that another one million people would love to sell their homes, but haven’t put their homes on the market. The shills touting their investments on CNBC every day fail to mention the approaching tsunami of Alt-A mortgage resets that will get under way in 2010 and not peak until 2013. These Alt-A mortgages are already defaulting at a 20% rate today
. There are $2.4 trillion Alt-A loans outstanding. Alt-A mortgages are characterized by borrowers with less than full documentation, lower credit scores, higher loan-to-values, and more investment properties.
There are more than 2 million Alt-A loans in the U.S. 28 percent of these loans are held by investors who don’t live in the properties they own. That includes interest-only home loans and pay-option adjustable rate mortgages. Option ARMs allow borrowers to pay less than they owe, with the rest added to the principal of the loan. When the debt exceeds a pre-set amount, or after a pre- determined time period has passed, the loan requires a bigger monthly payment.
How can housing return to “normality” with this amount of still toxic debt in the system? It can’t and it won’t.
ALT-A MORTGAGE RESETS

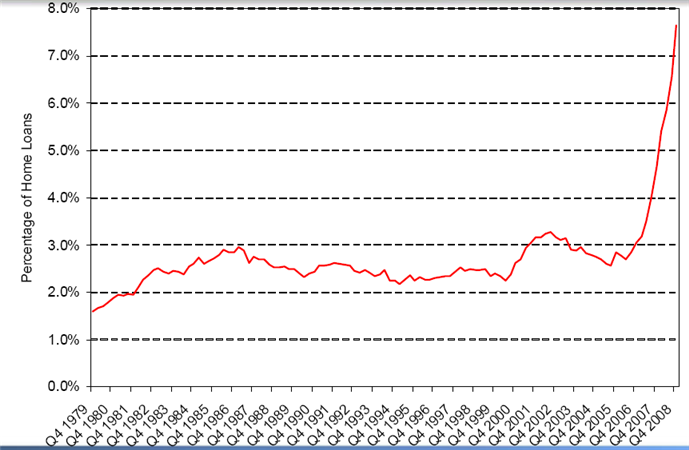
Mortgage delinquencies as a percentage of loans stayed between 2% and 3% from 1979 through 2007. I would categorize this as normal. The Mortgage Bankers Association just reported a delinquency rate of 9.12% on all mortgage loans, the highest since the MBA started keeping records in 1972. Also, the delinquency rate only includes late loans (30-days or more), but not loans in foreclosure. In the first quarter, the percentage of loans in foreclosure was 3.85%, an increase of 55 basis points from the prior quarter and 138 basis points from a year ago. Both the overall percentage and the quarter-to quarter increase are records. The combined percentage of loans in foreclosure and at least one payment late is 12.07%, another record. Delinquencies on subprime mortgage loans rose to 24.95% from 21.88% in the fourth quarter of 2008. Prime loan delinquencies rose to 6.06% from 5.06% one quarter ago, a significant and disturbing increase from a group of borrowers that aren’t expected to default.
With the 30-year mortgage rate approaching 5.7%, mortgage refinancing activity has plunged about 60% in the last two months. Mortgage applications for new home purchases collapsed at a 20% annual rate in May too. Normality in the mortgage market appears to be a few years away.
MORTGAGE DELINQUENCIES AS A % of LOANS
 http://seekingalpha.com/article/143010-the-debt-conundrum-part-i
 .. vabbè tanto il mese prossimo arriva come al solito la revisione