Var: miomov1,miomax1,miomin1,AA,BB,zona1,MMAA,MMBB,miomov2;
Var: signal,mioregrlin1,zona2;
installtakeprofit(INTICK,30);
installstoploss(INTICK,20);
////////////////////////////////////////////////////////////////////////////////
mioregrlin1 = REGRLIN(C,21);
miomax1 = HHV(H,30);
miomin1 = LLv(L,30);
miomov1 = MOV(C,7,s);
miomov2 = MOV(C,14,s);
AA = ((miomax1 - C)+ (miomov1)*miomax1)/C;
BB = ((miomin1 - C)+ (miomov1)*miomin1)/C;
MMAA = (AA+AA[1]+AA[2]+AA[3]+AA[4]+AA[5]+AA[6]+AA[7]+AA[8])/9;
MMBB = (BB+BB[1]+BB[2]+BB[3]+BB[4]+BB[5]+BB[6]+BB[7]+BB[8])/9;
////////////////////////////////////////////////////////////////////////////////
if AA > AA[1] and BB < BB[1] then signal= 1; endif;
if AA < AA[1] and BB > BB[1] then signal= 1; endif;
if AA < AA[1] and BB < BB[1] then signal = 0; endif;
if AA > AA[1] and BB > BB[1] then signal = 0;endif;
////////////////////////////////////////////////////////////////////////////////
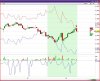
if signal = 1 and R > MOV(R,20,s) and C > mioregrlin1 and H = HHV(H,5) then entershort(nextbar,atopen); endif;
if signal =1 and R > MOV(R,20,s) and C < mioregrlin1 and L = LLV(L,5) then enterlong(nextbar,atopen); endif;
////////////////////////////////////////////////////////////////////////////////
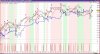
zona1 = createviewport(200, true, true);
PlotChart(signal,zona1, red, solid,1);
plotchart( AA,0,red,solid,1);
plotchart( BB,0,blue,solid,1);


 ..per ora va cosi..e non mi sembra vero che vt rispecchia il reale..
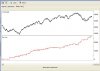


") [/FONT]
[/FONT]