//solospread:
//http://www.investireoggi.it/forum/costruzione-indicatore-per-analisi-ciclica-con-visual-trader-vt31296-459.html
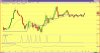
//Sotto il minimo della gialla si vende.
//Sopra il massimo della fuxia si compra.
//Quando si presenta una candela black , la probabilità di chiudere in gain è altissima
var: solospread,indzona1,miorsi,valentry;
miorsi = RSI(C,14,s);
if C[1] = O and B[1] and W and C < C[3] then colorbar(fuchsia);endif;
if C[1] = O and W[1] and B and C > C[3] then colorbar(yellow); endif;
if C[1] = O and B[1] and W then solospread =5; else solospread = 1; endif;
if C[1] = O and W[1] and B then solospread =5; else solospread = 1; endif;
if C[1] = O and B[1] and W and C < C[3] then valentry = H;endif;
if C[1] = O and W[1] and B and C > C[3] then valentry = L; endif;
if C[1] = O and B[1] and W and C < C[3] and miorsi < 25 then colorbar(black);endif;
if C[1] = O and W[1] and B and C > C[3] and miorsi > 75 then colorbar(black); endif;
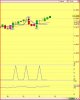
indzona1 = createviewport(200,true,true);
plotchart(solospread,indzona1,blue,solid,1);
plotchart(valentry,0,purple,solid,2);
// buy-sell signals
if C[1] = O and B[1] and W and C < C[3] and C >= valentry then
exitshort(NextBar,AtOpen);
enterlong(NextBar,AtOpen);
endif;
if C[1] = O and W[1] and B and C > C[3] and C <= valentry then
exitlong(NextBar,AtOpen);
entershort(NextBar,AtOpen);
endif;

")