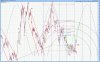
The mid-term Elliott Wave count of the USD index is shown below, with the thought pattern forming denoted in green. The bottoming pattern for wave [D] took longer to complete than expected, so the proposed rising pattern will likely occur, but shifted out in time by 4 months. The minimum upside target is 81-83, with an upside extreme of 85-87. All of this should occur by early February to April 2012. This is the minimum time frame expected and it could evolve into a longer pattern if wave [E] forms a triangle within a triangle (this occurrence could drag out wave [E] by 12 months). When these things happen they are immediately noted, but the passage of time must occur for that to happen.
")