Gennarino
Boh
E speriamo che questo sia di buon auspicio (per chi è long).
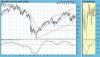
On the weekly bar chart we use crossovers of the 17-EMA and 43-EMA to mark official bull and bear market status. In August there was a downside EMA crossover that closed out the bull market that officially began with an upside EMA crossover in August 2009. This is a fairly reliable, albeit slow moving, timing model, and, while it is not normally subject to being whipsawed, there are certainly indications that it may be switching back to bullish very soon.
Currently, price is trying to break above the top of a triangle formation, and that would be positive if it could do so decisively. Also note in the thumbnail chart that price is above the EMAs, so they are converging, and an upside crossover will take place in a week or two as long as price remains above the EMAs. Finally, the PMO (Price Momentum Oscillator) is rising above its EMA, indicating positive internals.
Bottom Line: We like to emphasize that technical analysis is a windsock, which means it tells us the current wind direction, not which way the wind will be blowing in five minutes. Our model says we are still in a bear market, but that will change soon if prices maintain positive momentum. However, this positive view could change quickly with the next negative story about the EU debt crisis -- probably due on news stands sometime next week. Dealing with the stock market these days is like flying in the vicinity of thunder storms. Wind direction can change radically and without warning, and cautious pilots usually try to avoid these conditions.
Decision Point : S&P 500 Is Barely Bearish - Chart Spotlight


 stasera mi debbo inventare qualcosa per tenerlo sveglio fino alla mezzanotte, anche se la vedo dura perchè alle 10 si addormenta e prima delle 8 del mattino non si sveglia

")

 )
) 
