Jolly
Forumer attivo
"Rassegna stampa"
McLaren Report - US Share Market & Australian Share Market Reports
McLaren Report - US Share Market & Australian Share Market Reports - Bill McLaren
October 09 2009 CNBC squawkbox Europe
October 09 2009 CNBC squawkbox Europe
By Bill McLaren
Published on 10/9/2009
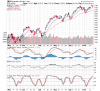
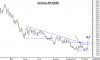
LET’S LOOK AT THE S&P 500 INDEX DAILY CHART
Two weeks ago I indicated the selloff would stop around 1027 and it stopped at 1019. We didn’t believe there would be a top until after the 6th of October. The index moved down into the 90 cycle indicating a rally but not another cycle up. Now our job is to look for some evidence this is now in a topping process. Please understand I am not looking for a big reversal in trend but a normal counter trend to consolidate the move up since March and possibly only the move since July. This could also set in with a large sideways pattern to consolidate. Since almost all high points and tops come from breaking to new highs and failing. If this rally can carry to a new high the trend will be at risk. Or if we can confirm a distribution of some sort prior to the new high a correction should start.
Today’s high was against the previous lower high and could set up a lower double top distribution pattern but the only evidence so far is the gap up and stopping at the price level of that high. One down day will not confirm that pattern there will need to be “follow through.” Volume is not bullish and the index overbalanced or exceeded the largest move down since the July low and that can also be a warning the trend may have completed. Since most world stock indexes gapped up yesterday on the fourth day up it did represent some sort of exhaustion but it is too early for me to conclude that has exhausted this move up and could just start a few days of consolidation. But if the index moves to a new high, that may be all to this rally. Also, there are one and two year cycles expiring this weekend and can be significant resistance. I believe a top is likely the next 5 trading days. The US Dollar Index may be the clue. But remember this trend does not top until 2010. A decline from here should be “normal” at 1/3 to 3/8 of the advance.
McLaren Report - US Share Market & Australian Share Market Reports
McLaren Report - US Share Market & Australian Share Market Reports - Bill McLaren
October 09 2009 CNBC squawkbox Europe
October 09 2009 CNBC squawkbox Europe
By Bill McLaren
Published on 10/9/2009
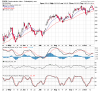
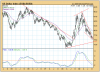
LET’S LOOK AT THE S&P 500 INDEX DAILY CHART
Two weeks ago I indicated the selloff would stop around 1027 and it stopped at 1019. We didn’t believe there would be a top until after the 6th of October. The index moved down into the 90 cycle indicating a rally but not another cycle up. Now our job is to look for some evidence this is now in a topping process. Please understand I am not looking for a big reversal in trend but a normal counter trend to consolidate the move up since March and possibly only the move since July. This could also set in with a large sideways pattern to consolidate. Since almost all high points and tops come from breaking to new highs and failing. If this rally can carry to a new high the trend will be at risk. Or if we can confirm a distribution of some sort prior to the new high a correction should start.
Today’s high was against the previous lower high and could set up a lower double top distribution pattern but the only evidence so far is the gap up and stopping at the price level of that high. One down day will not confirm that pattern there will need to be “follow through.” Volume is not bullish and the index overbalanced or exceeded the largest move down since the July low and that can also be a warning the trend may have completed. Since most world stock indexes gapped up yesterday on the fourth day up it did represent some sort of exhaustion but it is too early for me to conclude that has exhausted this move up and could just start a few days of consolidation. But if the index moves to a new high, that may be all to this rally. Also, there are one and two year cycles expiring this weekend and can be significant resistance. I believe a top is likely the next 5 trading days. The US Dollar Index may be the clue. But remember this trend does not top until 2010. A decline from here should be “normal” at 1/3 to 3/8 of the advance.
")