Nasdaq Nasdaq 101

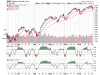
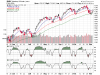
Mentre scrivo l'RSI 3gg è pari a 14,25: il sistema oversold/overbought acquisterà l'indice in chiusura se verrà confermato un valore di RSI 3 gg.<20, avallato, come pare al momento, dall' EMA StochRSI di breve periodo.
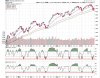
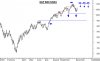
Operazione "kamikaze" naturalmente, anche perchè siamo al test del margine inferiore del rising wedge sul grafico giornaliero e probabilmente si andrà a testare l'EMA 50. L'operazione inoltre non trova per ora conferma da parte dello S&P 500......fatto che suggerisce estrema prudenza in quanto sono possibili ulteriori (e forse ampi) margini di discesa da questi livelli. Vedremo, ma sarà comunque interessante vedere come si comporterà il sistema contrarian......:) considerato che, come raccomandato nei post iniziali, stiamo facendo paper-trading.
 
Il sistema contrarian (oversold/overbought) ha acquistato l'indice Nasdaq 100 in chiusura (1722,46) in quanto RSI 3 gg.<20 con conferma di EMA StochRSI di breve periodo. Venderà l'indice quando RSI tre gg.>70.
In caso contrario acquisterà un'altra posizione se RSI 5 gg.<20.

Sistema trend follower: FLAT

Sistema contrarian: LONG
 

Allegati

  • sc.png
    sc.png
    26,3 KB · Visite: 206
Il sistema contrarian (oversold/overbought) ha acquistato un'altra posizione in chiusura (1682,06) in quanto RSI 5gg. <20 (14,86); questa posizione verrà chiusa quando RSI 5gg >50 in close.
Il sistema acquisterà un'ulteriore posizione se RSI 5gg <10 in close.
 
L'operazione era da "kamikaze" ed infatti abbiamo fatto un bello schianto: il close di giovedì (1711,27), inferiore al livello di 1727 segnalato la settimana scorsa nel post n°30, poteva essere interpretato come spia di allarme (con il solito "senno di poi")......ed infatti venerdì......
Comunque analizziamo questo ultimo e, almeno per ora, sfortunato trade: perso il margine inferiore del rising wedge sul grafico giornaliero e penetrata l'EMA 50, i prezzi si sono appoggiati (direi quasi che adesso sono sospesi) all'ema 65, media sempre molto significativa per l'indice Nasdaq 100: se non tiene questa sarà un bel problema mantenere in essere il trend al rialzo. Altro fatto da non sottovalutare è che i livelli dell'RSI a 3 e 5 gg. hanno toccato livelli addirittura inferiori ai livelli di febbraio-marzo, il che fa pensare ad un netto peggioramento del sentiment del mercato.
Vedremo i prossimi giorni come evolverà la situazione......il metodo comunque va seguito......sulla carta naturalmente......:)
 

Allegati

  • untitled3.jpg
    untitled3.jpg
    330,7 KB · Visite: 297
Ultima modifica:
Di seguito i "livelli" della scorsa settimana e quelli della prossima......:)
 

Allegati

  • untitled4.jpg
    untitled4.jpg
    199,7 KB · Visite: 312
  • untitled5.jpg
    untitled5.jpg
    94,7 KB · Visite: 283
Ultima modifica:
"Non dire gatto finchè non ce l'hai nel sacco......:)"
Comunque la posizione sull'indice acquistata a 1722,46 verrà chiusa se l'RSI 3 gg. sarà > 70 in chiusura; quella acquistata a 1682,06 verrà liquidata se l'RSI 5gg > 50 sempre in close.
 
Il sistema contrarian ha venduto in chiusura, al valore di 1721,09, entrambe le posizioni. Il risultato ottenuto è una perdita di 1,37 punti indice (- 0,08%) sulla posizione acquistata a 1722,46, mentre sulla posizione aperta a 1682,06 il sistema ha guadagnato 39,03 punti indice (+ 2,32%).
 

Allegati

  • sc.png
    sc.png
    28 KB · Visite: 179
Una primizia, da leggere per il weekend :)

November 06 2009 CNBC SQUAWKBOX EUROPEBy Bill McLaren


LET’S LOOK AT THE S&P 500 DAILY CHART

The up trend since August has been struggling as indicated by each new high quickly breaking back below the breakout point of the previous high. There were two probabilities that can apply here. Our preferred scenario and forecast calls for the index to move down 22, 30 or 45 calendar days to end this correction followed by a strong up trend to complete in 2010 for a significant top. The other alternative is for the index to go into a sideways pattern. Sideways patterns usually start at a previous low and most stock indexes have tested that low and rallied. The S&P is a few points short of that level but with all the other indexes at that level it remains possible. Because that previous low is an “obvious” support level -- a rally is normal if the trend were up or down. This rally should not exceed 4 trading days (first degree counter trend) if the trend remains down. If this rally is a counter trend rally it needs to slow down and not look like the vertical move up from the July low.
 

Allegati

  • e1106spe.jpg
    e1106spe.jpg
    35,5 KB · Visite: 262
LET’S LOOK AT THE SUPPORT AND RESISTANCE LEVELS FOR THE S&P

With all market we break the range of movement into 1/8 and 1/3. The normal correction for all trends is 1/3 to 3/8 of the advance when the trend runs this length of time. The same divisions are used when analyzing a leg within a trend. The ‘normal” correction within a leg of a trend is ¼ of that range and a correction that keeps the trend in a very strong position for the next advance is a ¼ retracement. This correction has not even hit the ¼ retracement of the entire range and seems too small a move down to end this correction unless the uptrend since July is still intact. So we are viewing this rally as a counter trend rally that will end by the 4th day. It could go a few days longer but with little advance as occurred June 25th through July 1st but with little price advance. If this rally is not a counter trend rally that will fail in the next few days there is a chance for an exhaustion style of move up but that remains on the bottom of the list for now after a sideways pattern.
 

Allegati

  • e1106ar1.jpg
    e1106ar1.jpg
    60,1 KB · Visite: 228
LET’S LOOK AT THE DOW JONES CHART OF 1975

The index has been following this roadmap very well. This is also the last time there was a dominate 5 year bear cycle and is the same cycle the index is trading within now. We can expect the same type of trend that occurred from 1975 through 1978 to occur now through 2012. I’ve highlighted the possible current location within this roadmap. This correction was approximately 3/8 retracement. We are looking at a possible ¼ retracement but 1/3 to 3/8 is would be normal to consolidate this advance and that’s our forecast.
So the rally fails in the next few days and resumes the move down to price and time objectives or I’m wrong and it tests the highs and likely 1120 at the 50% mark of the range down. Next week will be important.
 

Allegati

  • e1106dj75.jpg
    e1106dj75.jpg
    44,6 KB · Visite: 223

Users who are viewing this thread

Back
Alto