Nasdaq Nasdaq 101

Dopo l'opinione di Bill McLaren ecco una visione un pò differente del mercato, quella di Mike Paulenoff.

Familiar Feel to SP 500 Strength
by Mike Paulenoff
 

Allegati

  • 14958.png
    14958.png
    107,8 KB · Visite: 215
Ecco, con ritardo :-(, i livelli del Nasdaq 100 per questa settimana:

1775 LongBreakOut
1753 Short
1746
1738

1723
1716
1709 Long
1686 ShortBreakOut

N.B.: chiusura odierna: 1768,4
 
Aggiornamento trend.
Si può salire anche con volumi calanti, certo......:specchio:
 

Allegati

  • untitled2.jpg
    untitled2.jpg
    259 KB · Visite: 202
Ecco i livelli del Nasdaq 100 per questa settimana:

1813 LongBreakOut
1801 Short
1797
1793

1784
1780
1776 Long
1764 ShortBreakOut

N.B.: chiusura settimana scorsa: 1788,61
__________________
 
Al di là di tutte le previsioni che si possono ragionevolmente fare, l'importante è la posizione sul mercato che, al momento, rimane FLAT :)
 
Lettura per il weekend :)

Stocks Still Overvalued

by Carl Swenlin
November 20, 2009

Stocks have been in the overvalued end of the normal P/E range since the early-1990s, and this condition shows no sign of abating. Below is an excerpt from our daily earnings summary that will offer readers a better perspective. I have outlined the 2009 Q4 results because that is the first quarter not distorted by the huge loss reported in 2008 Q4. While the results of the current quarter are not final, 90% of companies have reported, and I don't think there will be any surprises from the remaining companies sufficient to change the estimated results a substantial amount. As you can see, valuations are projected to be well above the overvalued limit of the range (P/E of 20) through the first two quarters of 2010. If the market continues to rally, the over valuation will persist into the foreseeable future.
 

Allegati

  • 091120_cspot-1.png
    091120_cspot-1.png
    27,9 KB · Visite: 185
Seguito:

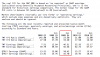
Since price movement over the last two decades seems to have little relationship to P/E ratios, why pay any attention to values? In fact, Decision Point's trend-following models consider price movement and nothing else. Nevertheless, we still want to be aware of the condition of the fundamental foundation of the market, and we believe that investor ignorance in this regard will only lead to more pain. After all, investors have been ignoring valuations for nearly two decades, and the result has been a stock bubble and two major bear markets. Most have not fared well during this period.
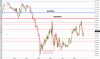
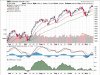
At each price top for the last two months I have been expecting a correction to begin, yet price declines have been relatively small and each top is followed by a higher top. Frustrating! I am not trying to identify a shorting opportunity, because shorting is not recommended during a bull market. The only reason that a decent correction is important is that it will provide a lower-risk opportunity to open new long positions. For two weeks the market has been rolling over into what could be another short-term top. Or it could be the beginning of the long-awaited correction. Negative divergences still abound, but, as I told a subscriber, these conditions are usually not too serious in a bull market. The market is vulnerable, but it is not a time for shorting. We could reasonably expect the rising wedge pattern to break down, but you can see that there is support just below the wedge.

Bottom Line: Market P/E tells us that there is no fundamental foundation under the market. This information is not useful in timing decisions, but it does tell us that there is more pain ahead in the long-term. In the short-term the market is topping again, and a correction is still possible.
Decisionpoint.com - Complete Market Research at a Glance
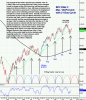
 

Allegati

  • SharpChartv05.png
    SharpChartv05.png
    26,6 KB · Visite: 190
ottimo lavoro Jolly!!
ti posto dei livelli per lunedi per un'operatività intraday.
Allora abbiamo due linee di tendenza che determinano se il trend sarà o positivo o nevativo e dei supp. e resit. dove i prezzi "dovrebbero" arrivare. E' da un'pò che li studio su carta e mi sembrano validi.
ti posto anche il grafico d venerdi con quest'ultimi.

Bias positivo: 1759.75
Bias negativo: 1758.75

Resistenze: 1761.00 1762.50 1765.50 1766.75 1768.00 1771.50 1773.25
Supporti: 1757.00 1755.00 1753.50 1752.00 1748.50
 

Allegati

  • 2011.PNG
    2011.PNG
    30,7 KB · Visite: 157
ottimo lavoro Jolly!!
ti posto dei livelli per lunedi per un'operatività intraday.
Allora abbiamo due linee di tendenza che determinano se il trend sarà o positivo o nevativo e dei supp. e resit. dove i prezzi "dovrebbero" arrivare. E' da un'pò che li studio su carta e mi sembrano validi.
ti posto anche il grafico d venerdi con quest'ultimi.

Bias positivo: 1759.75
Bias negativo: 1758.75

Resistenze: 1761.00 1762.50 1765.50 1766.75 1768.00 1771.50 1773.25
Supporti: 1757.00 1755.00 1753.50 1752.00 1748.50

Grazie :)
Vediamo un confronto con i livelli settimanali (che però si riferiscono all'indice e non al future).

1795 LongBreakOut
1780 Short
1775
1770

1759
1754
1749 Long
1733 ShortBreakOut

N.B.: chiusura settimana scorsa: 1764,39
 

Users who are viewing this thread

Back
Alto