ciao ragazzi, un passaggio veloce per un saluto
")
per quanto riguarda il mercato okkio che , a parte qualche rifiato fisiologico, nn e' aria di mollare l'osso. dopodomani Dragonzolo parla sui tassi e se taglia ci aspettano minimo altri 800 punti di salita a strappo da far saltare tutti gli shorters.
ciao ciao
Siamo in piena euforia... non si può sapere quando finisce....

Non concordo in tutto ma ci sono cose interessanti
CORRECTED – September Payrolls On Trend, August Revised Up As Expected After Misleading the Fed
October 22, 2013
By
Newswires
The BLS reported a seasonally adjusted (SA) gain of 148,000 in September nonfarm payrolls Tuesday, missing the consensus estimates of around 183,000. That
comes as no surprise to those of us following the real time data on Federal Withholding Tax collections, which weakened in September.
As I wrote last month, ” Based on the
strength of August Federal withholding tax collections, the current number is almost certain to be revised upward substantially. How would the market have reacted differently if given the facts, and how will the Fed evaluate this erroneous data?” Indeed the August number was revised up from +169,000 to +193,000.
Would the Fed have begun to taper QE had the correct data been available? Maybe, maybe not. But the bad data that they had for August certainly helped solidify the Fed’s decision not to cut QE.
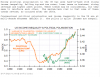
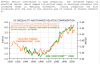
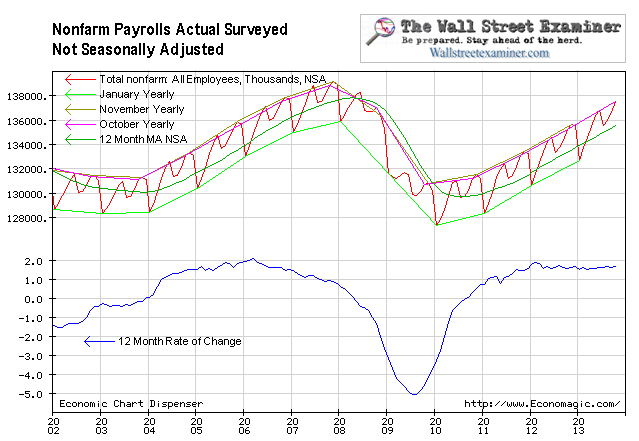
The trend of the actual, not seasonally adjusted data (NSA), has gone in a virtually straight line at an annual gain of approximately +1.6% for 23 months. This month was no exception, registering a year to year gain of 1.66%. The NSA data is not subject to material revisions like the SA data.
The September withholding tax data was weaker than August. The current headline payrolls number was consistent with that, so I do not expect a major revision in the number next month. While the revised numbers are more accurate than the initial release, the market doesn’t care about that. Investors focus on the initial release even though it is likely to be substantially revised in ensuing months. The BLS itself warns that the margin of error is +-90,000 in the first release.

Non Farm Payrolls NSA – Click to enlarge
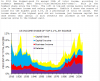
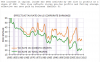
CORRECTED The September SA headline nonfarm payrolls number compares with a gain of 612,000 in the actual, not seasonally adjusted number (NSA). September is always an up month in non farm payrolls. Since the NSA number is not seasonally finagled we must look at the same month of past years to judge whether the current report good, so-so, or lousy.
Last year the September change was an increase of 621,000 and the year before 747,000. The 10 year average for September from 2003 to 2012 was an increase of 570,000. This year’s number was slightly better than the average and not materially worse than last year. END CORRECTED
There’s the question of full time versus part time jobs growth. I’ll address that in a subsequent post.
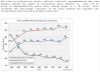
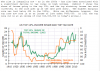
QE 3-4, which was announced in September 2012, with the cash flow starting in November, has not caused any increase in the growth rate. There’s absolutely no difference in the growth rate between the QE pause period in 2012 and since QE3-4 started. QE has not contributed to jobs growth. There is no trickle down. Bernanke’s cherished theory that rising equity prices due to QE would result in real economic growth, which he espoused in his 2010 oped in the Washington Post justifying QE2, is a sham.
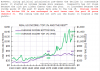
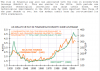
While QE has not spurred jobs growth, the same can’t be said for what the Fed’s shenanigans have done for stocks and housing prices, which have surged out of all proportion to the rate of jobs growth. I covered the comparative data on this in this post on the jobs number.
The fact that the market often reacts strongly to the latest month’s jobs figure is just another example of the absurd fixation with reacting to data that’s never correct on the first release and ultimately doesn’t matter anyway.
The market’s trend over time is based on money, not data. When there’s too much money around, the market rallies, and the pundits then provide the “reasons” or excuses. Excess liquidity causes asset bubbles to grow. They stop growing and bull markets end when liquidity is withdrawn.
The Fed is still providing plenty of excess liquidity, but it is not the only influence.
All central banks deal with the same major banks/dealers. The BoJ plays an important role in the US market and it continues to pump liquidity into the system. The ECB also plays a major roll, and it has been allowing money to be retired all year, with devastating results in the US Treasury market and emerging markets. That deleveraging trend has slowed in the past month. That deleveraging destroyed liquidity and created headwinds for the Fed and BoJ which they have typically overcome by printing a total of the equivalent of nearly $200 billion USD per month. With paydowns of ECB loans slowing in recent weeks, the drag that the markets had experienced in the first half of the year has eased. I cover these issues in depth each week in the
Professional Edition Fed and Treasury updates.

 Non Farm Payrolls NSA – Click to enlarge