The Weekly Report For August 24th - August 28th, 2009
[FONT=Arial, Helvetica, sans-serif]
Commentary: Options expiration week ended with a bang, with a strong display by the bulls. The general markets surged to new rally highs after an early-week pullback threatened to become a more serious correction. All the major market indexes gapped down sharply on Monday and finished the day at their lows, hinting at more weakness to come during the week. However, beginning Tuesday, the markets began to stair-step their way higher, and ended with a sharp move to new highs by Friday. Financials had a strong week, with banks like JP Morgan Chase & Co. (NYSE:JPM) finishing the week at new recovery highs. Several oil stocks also rallied sharply to close out the week, after threatening to break down. The Oil Service HOLDRs ETF (NYSE:OIH) started Monday by breaking under near-term support, but still rallied to clear its base by Friday. In the end, it was a volatile week that ended up frustrating short sellers once again.[/FONT]
[FONT=Arial, Helvetica, sans-serif]IN PICTURES: 7 Tools Of The Trade[/FONT][FONT=Arial, Helvetica, sans-serif]
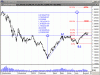
In looking at the chart for the S&P 500 SPDRS (NYSE:SPY) ETF, you can see the gap down on Monday that took the ETF below its 20-day moving average. The gap down was ominous at the time, and looked like it was the start of a deeper correction that would lead to a test of the July breakout. However, SPY recovered throughout the week, and cleared the small consolidation area it formed through July. As noted on the chart, SPY is starting to show a MACD divergence, which hints at waning momentum. The August low is now an important level to watch if the breakout ends up reversing next week. (For related reading, check out What does it mean to use technical divergence in trading?)
[/FONT][FONT=Arial, Helvetica, sans-serif]
[/FONT][FONT=Arial, Helvetica, sans-serif]
Source: StockCharts.com[/FONT]
[FONT=Arial, Helvetica, sans-serif]The Diamonds Trust Series 1 (NYSE:DIA) ETF, which tracks the Dow Jones Industrial Average, shows a similar pattern. DIA ended the week at new highs after Monday's gap down, but is showing the same MACD divergence as SPY. While these divergences can resolve themselves through time, they often serve as a warning that a move is getting extended. [/FONT]
[FONT=Arial, Helvetica, sans-serif]
[/FONT][FONT=Arial, Helvetica, sans-serif]
Source: StockCharts.com[/FONT]
[FONT=Arial, Helvetica, sans-serif]The iShares Russell 2000 Index (NYSE:IWM) ETF chart is showing more of the same. IWM has now held support above its November highs and could be targeting a test of a major prior support level near $64. This was the level that held on three separate occasions in 2008 until finally giving way through the sharp decline during the financial crisis. As a former support level, it could serve as formidable resistance moving forward. [/FONT]
[FONT=Arial, Helvetica, sans-serif]
[/FONT][FONT=Arial, Helvetica, sans-serif]
Source: StockCharts.com[/FONT]
[FONT=Arial, Helvetica, sans-serif]The Powershares QQQ ETF (Nasdaq:QQQQ) continues to diverge from its peers. While the other major index ETFs rallied to new highs, QQQQ surprisingly held at resistance. This may end up being a minor blip if QQQQ follows its peers higher next week, but it serves as an additional caution signal. Tech stocks have led for the majority of this rally, and the fact that they are lagging at this point is definitely worth monitoring.[/FONT]
[FONT=Arial, Helvetica, sans-serif]
[/FONT][FONT=Arial, Helvetica, sans-serif]
Source: StockCharts.com[/FONT]
[FONT=Arial, Helvetica, sans-serif]
Have a Great Day![/FONT]
[FONT=Arial, Helvetica, sans-serif]By Joey Fundora[/FONT]
[FONT=Arial, Helvetica, sans-serif]Joey Fundora is an independent trader located in South Florida. Joey focuses on using technical analysis techniques to uncover supply and demand imbalances in equities. To see more of his work, visit his site on Stock Chart Analysis.[/FONT]


")


