paologorgo
Chapter 11
A Tale of Two Depressions
This is an update of the authors' 6 April 2009 column comparing today's global crisis to the Great Depression. World industrial production, trade, and stock markets are diving faster now than during 1929-30. Fortunately, the policy response to date is much better. The update shows that trade and stock markets have shown some improvement without reversing the overall conclusion -- today's crisis is at least as bad as the Great Depression.
Editor’s note: The 6 April 2009 Vox column by Barry Eichengreen and Kevin O’Rourke shattered all Vox readership records, with 30,000 views in less than 48 hours and over 100,000 within the week. The authors will update the charts as new data emerges; this updated column is the first, presenting monthly data up to April 2009. (The updates and much more will eventually appear in a paper the authors are writing a paper for Economic Policy.)
New findings:
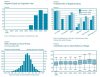
Updated Figure 1. World Industrial Output, Now vs Then (updated)

Updated Figure 2. World Stock Markets, Now vs Then (updated)

Updated Figure 3. The Volume of World Trade, Now vs Then (updated)

Updated Figure 4. Central Bank Discount Rates, Now vs Then (7 country average)

New Figure 5. Industrial output, four big Europeans, then and now

New Figure 6. Industrial output, four Non-Europeans, then and now.

New Figure 7: Industrial output, four small Europeans, then and now.

Start of original column (published 6 April 2009)
The parallels between the Great Depression of the 1930s and our current Great Recession have been widely remarked upon. Paul Krugman has compared the fall in US industrial production from its mid-1929 and late-2007 peaks, showing that it has been milder this time. On this basis he refers to the current situation, with characteristic black humour, as only “half a Great Depression.” The “Four Bad Bears” graph comparing the Dow in 1929-30 and S&P 500 in 2008-9 has similarly had wide circulation (Short 2009). It shows the US stock market since late 2007 falling just about as fast as in 1929-30.
Comparing the Great Depression to now for the world, not just the US
This and most other commentary contrasting the two episodes compares America then and now. This, however, is a misleading picture. The Great Depression was a global phenomenon. Even if it originated, in some sense, in the US, it was transmitted internationally by trade flows, capital flows and commodity prices. That said, different countries were affected differently. The US is not representative of their experiences.
Our Great Recession is every bit as global, earlier hopes for decoupling in Asia and Europe notwithstanding. Increasingly there is awareness that events have taken an even uglier turn outside the US, with even larger falls in manufacturing production, exports and equity prices.
In fact, when we look globally, as in Figure 1, the decline in industrial production in the last nine months has been at least as severe as in the nine months following the 1929 peak. (All graphs in this column track behaviour after the peaks in world industrial production, which occurred in June 1929 and April 2008.) Here, then, is a first illustration of how the global picture provides a very different and, indeed, more disturbing perspective than the US case considered by Krugman, which as noted earlier shows a smaller decline in manufacturing production now than then.
Figure 1. World Industrial Output, Now vs Then

Source: Eichengreen and O’Rourke (2009) and IMF.
Similarly, while the fall in US stock market has tracked 1929, global stock markets are falling even faster now than in the Great Depression (Figure 2). Again this is contrary to the impression left by those who, basing their comparison on the US market alone, suggest that the current crash is no more serious than that of 1929-30.
Figure 2. World Stock Markets, Now vs Then

Source: Global Financial Database.
Another area where we are “surpassing” our forbearers is in destroying trade. World trade is falling much faster now than in 1929-30 (Figure 3). This is highly alarming given the prominence attached in the historical literature to trade destruction as a factor compounding the Great Depression.
Figure 3. The Volume of World Trade, Now vs Then

Sources: League of Nations Monthly Bulletin of Statistics, http://www.cpb.nl/eng/research/sector2/data/trademonitor.html
It’s a Depression alright
To sum up, globally we are tracking or doing even worse than the Great Depression, whether the metric is industrial production, exports or equity valuations. Focusing on the US causes one to minimise this alarming fact. The “Great Recession” label may turn out to be too optimistic. This is a Depression-sized event.
That said, we are only one year into the current crisis, whereas after 1929 the world economy continued to shrink for three successive years. What matters now is that policy makers arrest the decline. We therefore turn to the policy response.
Policy responses: Then and now
Figure 4 shows a GDP-weighted average of central bank discount rates for 7 countries. As can be seen, in both crises there was a lag of five or six months before discount rates responded to the passing of the peak, although in the present crisis rates have been cut more rapidly and from a lower level. There is more at work here than simply the difference between George Harrison and Ben Bernanke. The central bank response has differed globally.
Figure 4. Central Bank Discount Rates, Now vs Then (7 country average)

Source: Bernanke and Mihov (2000); Bank of England, ECB, Bank of Japan, St. Louis Fed, National Bank of Poland, Sveriges Riksbank.
Figure 5 shows money supply for a GDP-weighted average of 19 countries accounting for more than half of world GDP in 2004. Clearly, monetary expansion was more rapid in the run-up to the 2008 crisis than during 1925-29, which is a reminder that the stage-setting events were not the same in the two cases. Moreover, the global money supply continued to grow rapidly in 2008, unlike in 1929 when it levelled off and then underwent a catastrophic decline.
Figure 5. Money Supplies, 19 Countries, Now vs Then

Source: Bordo et al. (2001), IMF International Financial Statistics, OECD Monthly Economic Indicators.
Figure 6 is the analogous picture for fiscal policy, in this case for 24 countries. The interwar measure is the fiscal surplus as a percentage of GDP. The current data include the IMF’s World Economic Outlook Update forecasts for 2009 and 2010. As can be seen, fiscal deficits expanded after 1929 but only modestly. Clearly, willingness to run deficits today is considerably greater.
Figure 6. Government Budget Surpluses, Now vs Then

Source: Bordo et al. (2001), IMF World Economic Outlook, January 2009.
Conclusion
To summarise: the world is currently undergoing an economic shock every bit as big as the Great Depression shock of 1929-30. Looking just at the US leads one to overlook how alarming the current situation is even in comparison with 1929-30.
The good news, of course, is that the policy response is very different. The question now is whether that policy response will work. For the answer, stay tuned for our next column.
http://www.voxeu.org/index.php?q=node/3421
This is an update of the authors' 6 April 2009 column comparing today's global crisis to the Great Depression. World industrial production, trade, and stock markets are diving faster now than during 1929-30. Fortunately, the policy response to date is much better. The update shows that trade and stock markets have shown some improvement without reversing the overall conclusion -- today's crisis is at least as bad as the Great Depression.
Editor’s note: The 6 April 2009 Vox column by Barry Eichengreen and Kevin O’Rourke shattered all Vox readership records, with 30,000 views in less than 48 hours and over 100,000 within the week. The authors will update the charts as new data emerges; this updated column is the first, presenting monthly data up to April 2009. (The updates and much more will eventually appear in a paper the authors are writing a paper for Economic Policy.)
New findings:
- World industrial production continues to track closely the 1930s fall, with no clear signs of ‘green shoots’.
- World stock markets have rebounded a bit since March, and world trade has stabilised, but these are still following paths far below the ones they followed in the Great Depression.
- There are new charts for individual nations’ industrial output. The big-4 EU nations divide north-south; today’s German and British industrial output are closely tracking their rate of fall in the 1930s, while Italy and France are doing much worse.
- The North Americans (US & Canada) continue to see their industrial output fall approximately in line with what happened in the 1929 crisis, with no clear signs of a turn around.
- Japan’s industrial output in February was 25 percentage points lower than at the equivalent stage in the Great Depression. There was however a sharp rebound in March.
Updated Figure 1. World Industrial Output, Now vs Then (updated)
Updated Figure 2. World Stock Markets, Now vs Then (updated)
Updated Figure 3. The Volume of World Trade, Now vs Then (updated)
Updated Figure 4. Central Bank Discount Rates, Now vs Then (7 country average)
New Figure 5. Industrial output, four big Europeans, then and now
New Figure 6. Industrial output, four Non-Europeans, then and now.
New Figure 7: Industrial output, four small Europeans, then and now.
Start of original column (published 6 April 2009)
The parallels between the Great Depression of the 1930s and our current Great Recession have been widely remarked upon. Paul Krugman has compared the fall in US industrial production from its mid-1929 and late-2007 peaks, showing that it has been milder this time. On this basis he refers to the current situation, with characteristic black humour, as only “half a Great Depression.” The “Four Bad Bears” graph comparing the Dow in 1929-30 and S&P 500 in 2008-9 has similarly had wide circulation (Short 2009). It shows the US stock market since late 2007 falling just about as fast as in 1929-30.
Comparing the Great Depression to now for the world, not just the US
This and most other commentary contrasting the two episodes compares America then and now. This, however, is a misleading picture. The Great Depression was a global phenomenon. Even if it originated, in some sense, in the US, it was transmitted internationally by trade flows, capital flows and commodity prices. That said, different countries were affected differently. The US is not representative of their experiences.
Our Great Recession is every bit as global, earlier hopes for decoupling in Asia and Europe notwithstanding. Increasingly there is awareness that events have taken an even uglier turn outside the US, with even larger falls in manufacturing production, exports and equity prices.
In fact, when we look globally, as in Figure 1, the decline in industrial production in the last nine months has been at least as severe as in the nine months following the 1929 peak. (All graphs in this column track behaviour after the peaks in world industrial production, which occurred in June 1929 and April 2008.) Here, then, is a first illustration of how the global picture provides a very different and, indeed, more disturbing perspective than the US case considered by Krugman, which as noted earlier shows a smaller decline in manufacturing production now than then.
Figure 1. World Industrial Output, Now vs Then
Source: Eichengreen and O’Rourke (2009) and IMF.
Similarly, while the fall in US stock market has tracked 1929, global stock markets are falling even faster now than in the Great Depression (Figure 2). Again this is contrary to the impression left by those who, basing their comparison on the US market alone, suggest that the current crash is no more serious than that of 1929-30.
Figure 2. World Stock Markets, Now vs Then
Source: Global Financial Database.
Another area where we are “surpassing” our forbearers is in destroying trade. World trade is falling much faster now than in 1929-30 (Figure 3). This is highly alarming given the prominence attached in the historical literature to trade destruction as a factor compounding the Great Depression.
Figure 3. The Volume of World Trade, Now vs Then
Sources: League of Nations Monthly Bulletin of Statistics, http://www.cpb.nl/eng/research/sector2/data/trademonitor.html
It’s a Depression alright
To sum up, globally we are tracking or doing even worse than the Great Depression, whether the metric is industrial production, exports or equity valuations. Focusing on the US causes one to minimise this alarming fact. The “Great Recession” label may turn out to be too optimistic. This is a Depression-sized event.
That said, we are only one year into the current crisis, whereas after 1929 the world economy continued to shrink for three successive years. What matters now is that policy makers arrest the decline. We therefore turn to the policy response.
Policy responses: Then and now
Figure 4 shows a GDP-weighted average of central bank discount rates for 7 countries. As can be seen, in both crises there was a lag of five or six months before discount rates responded to the passing of the peak, although in the present crisis rates have been cut more rapidly and from a lower level. There is more at work here than simply the difference between George Harrison and Ben Bernanke. The central bank response has differed globally.
Figure 4. Central Bank Discount Rates, Now vs Then (7 country average)
Source: Bernanke and Mihov (2000); Bank of England, ECB, Bank of Japan, St. Louis Fed, National Bank of Poland, Sveriges Riksbank.
Figure 5 shows money supply for a GDP-weighted average of 19 countries accounting for more than half of world GDP in 2004. Clearly, monetary expansion was more rapid in the run-up to the 2008 crisis than during 1925-29, which is a reminder that the stage-setting events were not the same in the two cases. Moreover, the global money supply continued to grow rapidly in 2008, unlike in 1929 when it levelled off and then underwent a catastrophic decline.
Figure 5. Money Supplies, 19 Countries, Now vs Then
Source: Bordo et al. (2001), IMF International Financial Statistics, OECD Monthly Economic Indicators.
Figure 6 is the analogous picture for fiscal policy, in this case for 24 countries. The interwar measure is the fiscal surplus as a percentage of GDP. The current data include the IMF’s World Economic Outlook Update forecasts for 2009 and 2010. As can be seen, fiscal deficits expanded after 1929 but only modestly. Clearly, willingness to run deficits today is considerably greater.
Figure 6. Government Budget Surpluses, Now vs Then
Source: Bordo et al. (2001), IMF World Economic Outlook, January 2009.
Conclusion
To summarise: the world is currently undergoing an economic shock every bit as big as the Great Depression shock of 1929-30. Looking just at the US leads one to overlook how alarming the current situation is even in comparison with 1929-30.
The good news, of course, is that the policy response is very different. The question now is whether that policy response will work. For the answer, stay tuned for our next column.
http://www.voxeu.org/index.php?q=node/3421


") ...
... 


 315 MLD EUR circa !