Ultima Markets Daily Insights - Forex, indici, economia e politica

Progress in trade talks, dovish Fed sparks risk-on rally – gold tests key $4,000 support


Macro scenario: trade truce + dovish Fed

US-China Agreement:

A "substantial framework agreement" was reached in Malaysia. No new 100 percent tariffs and a likely deferral of controls on rare earths.
Trump and Xi are expected to finalize the agreement during this week's APEC summit.

Result:
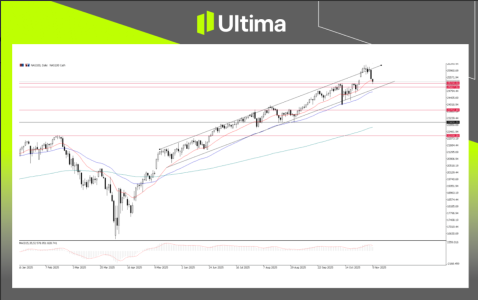
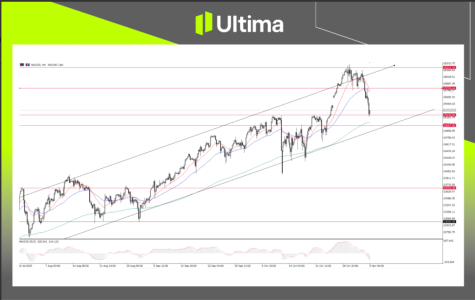
Global risk sentiment improves: Asian stocks gain more than 2 percent, S&P 500 and Nasdaq futures rise, along with oil and copper.
Safe-haven assets such as gold and Treasuries are experiencing profit-taking as risk appetite returns to the market.

Fed Expectations:
A lower-than-expected core CPI strengthens the Fed's accommodative stance. A rate cut is now fully priced in for this week's FOMC meeting.

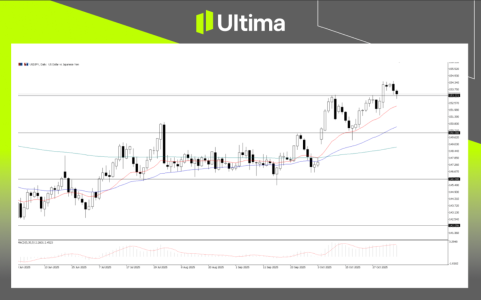
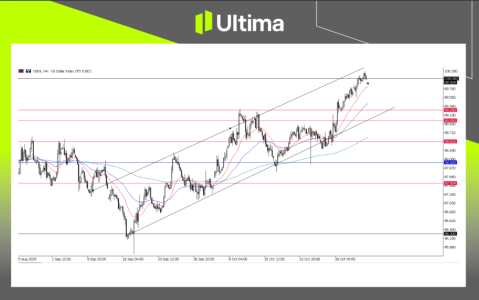
US Dollar Index (USDX): Sideways but Vulnerable

Technical analysis:

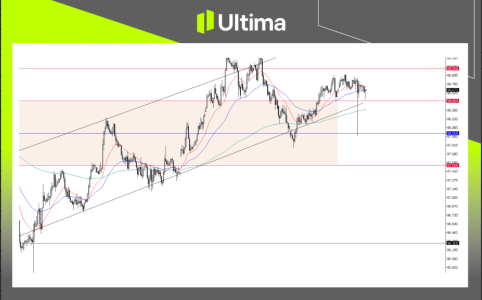
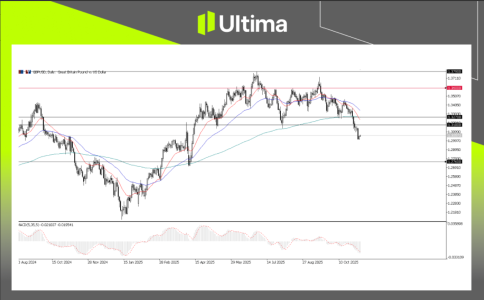
Falling inflation has hit the dollar, but support at 98.00 has held. The index is now above 98.50.
However, the Fed's dovish outlook could limit further gains.

Key levels:
  • Support: 98.50 (a break would reopen the bearish risk)
  • Resistance: 99.00
USDX, 2-Hour Chart | Source: Ultima Markets MT5

Gold (XAU/USD): Corrective phase underway, $4,000 remains crucial

Main drivers:

The easing of trade tensions has reduced demand for safe-haven assets. Profit-taking is accelerating the corrective movement.

Technical Analysis:
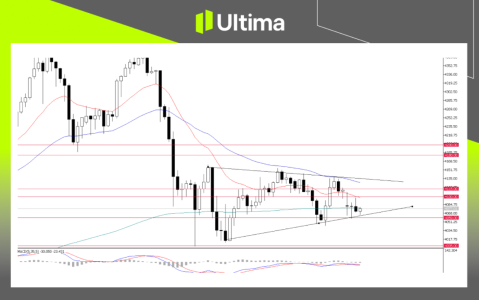
The metal is testing the key support at $4,000, the so-called “battle zone”.
  • Above $4,000: likely uneven consolidation.
  • Below $4,000: room for further decline, with subsequent supports at $3,950 and $3,900.
Tactical view:
Bears are waiting for a breakout, while bulls are defending the psychological level.

XAU/USD, 2-Hour Chart | Source: Ultima Markets MT5

What to monitor
  • FOMC and CPI: A more aggressive rate cut could weigh on the dollar and gold, while supporting risky assets.
  • APEC Summit: Further progress in trade negotiations would maintain the "risk-on" tone. Any disappointment could reverse the trend.
  • Technical triggers: 98.50 for USDX and $4,000 for gold remain the key levels.
Discussion:
➔ Are you shorting gold below $4,000 or waiting for a rebound?
➔ Is the dollar's rebound sustainable, or will the Fed limit gains?
➔ How are you positioning yourself ahead of the APEC summit?
 

Allegati

  • XAUUSD.png
    XAUUSD.png
    184,2 KB · Visite: 8
  • USDX.png
    USDX.png
    211,8 KB · Visite: 7
The Fed surprises with a hawkish rate cut: the dollar strengthens, attention shifts to the ECB and BOJ.


Fed Decision: 25 basis point cut but tightening tone

The Federal Reserve cut rates by 25 basis points, as expected, but accompanied the move with a surprisingly cautious message.

Powell said:
"It's far from certain that there will be another cut in December. Further decisions will depend entirely on the data."
A clear shift from a dovish stance to a more cautiously hawkish one.

Market reaction:
  • The odds of a further cut in December have fallen from 90 to 32 percent (CME FedWatch).
  • The dollar jumped, while stocks and gold fell.
Global Focus: ECB and BOJ Under Watch

Bank of Japan:

  • The rate is expected to remain unchanged at 0.5 percent.
  • The US-Japan yield differential widens further, favoring USD/JPY.
European Central Bank:
  • Expectations remain unchanged with a neutral and data-driven tone.
  • Contrast with more hawkish Fed puts pressure on EUR/USD.
Technical Analysis: Key Levels

US Dollar Index (USDX):

  • Strong post-Fed rebound, bullish structure intact.
  • Resistance: 99.00 – a break would confirm a bullish breakout.
  • Support: 98.50 – bulls are defending this area.
USDX.png

USDX, 4-hour chart | Source: Ultima Markets MT5

USD/JPY:
  • Strong rally after the Fed, now near multi-month highs at 153.00.
  • BOJ unchanged + Fed hawkish = bullish momentum.
  • Resistance: 153.00 – break could trigger new highs.
USDJPY.png

USD/JPY, H4 Chart | Source: Ultima Markets MT5

EUR/USD:
  • Sharp post-Fed decline, with a temporary break of 1.1600.
  • Risk: A close below 1.1600 opens the way to 1.1550.
  • A dovish ECB would accelerate the decline.
EURUSD H4.png

EUR/USD, H4 Chart | Source: Ultima Markets MT5

What to monitor
  • US data: Any surprises will directly impact expectations for the Fed and the dollar.
  • ECB/BOJ meetings: ECB dovish or BOJ firm = further dollar strength, with increased volatility on EUR/USD and USD/JPY.
  • Technical triggers:
    • USDX above 99.00 = breakout confirmed.
    • USD/JPY above 153.00 = new highs.
    • EUR/USD below 1.1600 = room for further downside.
Discussion:
➔ Are you buying dollars based on policy divergence or do you expect a correction?
➔ Will USD/JPY break 153 or will intervention risk increase?
➔ Is EUR/USD likely to fall further if the ECB remains accommodative?
 
US-China-Handelsfrieden treibt Märkte an – Risiken bleiben bestehen


Makro-Thema: Handelsfrieden vs. US-Regierungsstillstand

Handelsfrieden:

Trump und Xi einigten sich auf eine einjährige Aussetzung neuer Zölle, einschließlich einer Entlastung bei seltenen Erden.
Dies stärkt die weltweite Risikostimmung, führt zuflüssen in zyklische und Schwellenländeraktien und stabilisiert das Industriesentiment.

US-Regierungsstillstand:
Der Shutdown dauert nun seit 34 Days an und blockiert die Veröffentlichung wichtiger Wirtschaftsdaten (BIP, NFP, Einzelhandelsumsätze).
Die Datenunsicherheit steigt, was die Argumente für eine dovishe Fed unterstützt.
Die Märkte müssen sich auf private Indicatoren wie den ISM verlassen.

Heutiger Focus: ISM Manufacturing PMI
From official data, is the ISM PMI derzeit der wichtigste Indicator für das US-Wachstum.
Eine Stabilisierung könnte den Dollar und die Aktien weiter antreiben, während eine Enttäuschung Gewinnmitnahmen auslösen könnte.

US-Dollar-Index (USDX): Bullen visieren 100 an
Aktuell:
99,60 (Aufwärtstrend seit Mitte Oktober)

Treiber:
  • Hawkishe Fed und geldpolitische Divergenz zu EZB und BoJ.
Technical Marks:
  • Widerstand: 100.00–100.30 (Schlusskurs darüber = mittelfristig bullische Bestätigung).
  • Unterstützungen: 99.25 & 99.00 (Bullen bleiben im Vorteil oberhalb von 99).
Ausblick:
Kurzfristiger Aufwärtstrend bleibt intact, aber fehlende Daten könnten Gewinne bei 100 begrenzen.

USDX.png

USDX, H4-Chart | Those: Ultima Markets MT5

US-Aktien (S&P 500): Aufwärtstrend pausiert, Korrekturrisiko steigt
Aktuell:
approx. 6900 (Rekordhoch, Konsolidierung)

Technical Marks:
  • Widerstand: 6900–6930 (horizontale & Kanalobergrenze).
  • Unterstützung: 6775 (Trendlinie = „Bullenverteidigung“).
Technical Einschätzung:
  • Bruch über 6900 → Fortsetzung des Aufwärtstrends.
  • Rücksetzer von der Widerstandszone → gesunde Korrektur bis 6775 möglich.
  • Momentum lässt nach, Seitwärtsbewegung wahrscheinlich ohne starken Impuls.
SP500.png

S&P 500, Tageschart | Those: Ultima Markets MT5

Fazit & Beobachtungspunkte
Risikobereitschaft bleibt hoch (Handelsfrieden), doch die Marktanfälligkeit steigt (Tech-Breite, Shutdown-Unsicherheit).

Short-term drivers:
  • ISM-PMI-Ergebnisse heute.
  • Dauer des Shutdowns & NFP-Veröffentlichung.
  • Quartalszahlen im Technologiesektor.
Handelsstrategie:
Beobachten Sie die Marken 100 im USDX und 6900 im S&P 500 auf Ausbruch oder Umkehr.
Bleiben Sie flexibel – die Datenlücke und Schlagzeilenrisiken bleiben hoch.

Diskussion:
➔ Kaufen Sie den Ausbruch oder sichern Sie sich gegen eine Korrektur ab?
➔Wird a Lossung des Shutdowns ainere Rally auslösen oder steht a Consolidierung bevor?
➔ Wie passen Sie Ihre Strategien an, wenn offizielle Daten fehlen?
 
Tregua commerciale USA-Cina sostiene i mercati, ma i rischi restano

Tema macro: tregua commerciale vs. shutdown del governo USA

Tregua commerciale:

Trump e Xi hanno concordato una sospensione di un anno dei nuovi dazi, inclusa una riduzione delle restrizioni sulle terre rare.
La notizia migliora il sentiment globale di rischio, favorisce i flussi verso i titoli ciclici e i mercati emergenti, e stabilizza la fiducia industriale.

Shutdown del governo USA:
Giunto al 34° giorno, blocca la pubblicazione di dati economici chiave (PIL, NFP, vendite al dettaglio).
Aumenta l’incertezza sui dati e rafforza l’idea di una Fed più accomodante.
I mercati si affidano a indagini private come l’ISM per orientarsi.

Focus di oggi: ISM Manufacturing PMI
Con i dati ufficiali sospesi, l’indice ISM rappresenta il principale barometro dell’economia USA.
Un miglioramento potrebbe sostenere il dollaro e le borse, mentre un calo del dato potrebbe spingere prese di profitto.

Indice del dollaro USA (USDX): i rialzisti puntano a 100
Attuale:
99,60 (trend rialzista da metà ottobre)

Fattori di spinta:
  • Fed hawkish e divergenza politica rispetto a BCE e BoJ.
Livelli tecnici:
  • Resistenza: 100,00–100,30 (chiusura sopra = conferma rialzista di medio periodo).
  • Supporto: 99,25 e 99,00 (trend rialzista intatto sopra 99).
Outlook:
La forza a breve resta solida, ma la mancanza di dati ufficiali potrebbe limitare i guadagni vicino a 100.

USDX.png

USDX, Grafico H4 | Fonte: Ultima Markets MT5

Azioni USA (S&P 500): trend in pausa, rischio di correzione in aumento
Attuale:
circa 6900 (massimi storici, in consolidamento)

Livelli tecnici:
  • Resistenza: 6900–6930 (orizzontale e canale superiore).
  • Supporto: 6775 (trendline = “difesa dei rialzisti”).
Analisi tecnica:
  • Sopra 6900 → trend rialzista riprende.
  • Reazione negativa → probabile pullback verso 6775.
  • Momentum in rallentamento, probabile fase laterale.
SP500.png

S&P 500, Grafico Giornaliero | Fonte: Ultima Markets MT5

Sintesi e punti da seguire
L’appetito per il rischio resta alto (tregua commerciale), ma cresce la vulnerabilità del mercato (tech, incertezza da shutdown).

Driver principali a breve:
  • Dati ISM PMI di oggi.
  • Durata dello shutdown e stato della pubblicazione NFP.
  • Aggiornamenti sugli utili del settore tecnologico.
Strategia operativa:
Monitorare i livelli 100 per USDX e 6900 per S&P 500 per segnali di breakout o inversione.
Mantenere un approccio flessibile: i rischi da notizie e la carenza di dati restano elevati.

Discussione:
➔ State comprando il breakout o vi state coprendo da una correzione?
➔ La fine dello shutdown potrebbe alimentare una nuova gamba rialzista o il mercato è vicino a un massimo?
➔ Come adattate la vostra analisi in assenza di dati ufficiali?
 
Crypto market under pressure: political stalemate and reduced liquidity weigh on sentiment.


Macroeconomic headwinds: US shutdown and liquidity crunch

US government shutdown:

Record 35 days without resolution.
The CBO estimates a 2-3 percent impact on fourth-quarter GDP.
A data vacuum: no official NFP or GDP, complicating the Fed's decisions.

Liquidity crunch:
The Fed has implemented a hawkish rate cut, with Powell cautious and less inclined to further easing.
The strengthening dollar is reducing global liquidity.
Risk assets (stocks, emerging currencies, cryptocurrencies) remain under pressure.

Technical Analysis: Pressures and Key Levels

Bitcoin (BTC/USD)
Current:
Consolidation below 110,000, range 110,000–105,000.
Key support: 105,000
  • Break below 105,000 = risk of a medium-term bearish reversal.
  • Above 105,000 = Volatile sideways movement likely.
  • Below 105,000 = room for 100,000 and below.

BTC/USD Daily Chart | Source: Ultima Markets MT5

Ethereum (ETH/USD)
Current:
Down below 3,900, towards 3,600.
Pattern: Descending triangle (bearish bias).
Key support: 3,600
  • Break below 3,600 = bearish continuation signal.
  • Below 3,600 = target 3,400 and 3,200.
  • Above 3,600 = sideways phase, but technical structure remains fragile.

ETH/USD Daily Chart | Source: Ultima Markets MT5

What to observe
  • US political headlines: Shutdown developments have a direct impact on sentiment.
  • Dollar strength and liquidity: DXY rally = hurdle for crypto.
  • Key technical levels:
    • BTC: 105,000
    • ETH: 3,600
Macro summary and caution
: Uncertainty and liquidity crunch weigh on risky assets.
Cryptocurrencies risk further declines if support breaks.

Trading strategy:
Monitor BTC 105K and ETH 3,600 for signs of a breakout or rebound.
Remain flexible: macroeconomic and technical risks remain elevated.

Discussion:
➔ Are you waiting for support to break before shorting, or do you prefer to trade in the range?
➔ How do you hedge against a strong dollar and data dearth?
➔ What signals would make you bullish on cryptocurrencies again?
 

Allegati

  • ETHUSD.png
    ETHUSD.png
    234,1 KB · Visite: 2
  • BTCUSD.png
    BTCUSD.png
    251,5 KB · Visite: 4
Correzione globale si approfondisce: sopravvalutazione tech, stallo politico e chiusura dei carry trade


Mercati azionari globali: forte calo dopo il rally dell’IA

Le borse mondiali registrano il peggior ribasso giornaliero degli ultimi mesi a causa dei timori di sopravvalutazione nel settore tecnologico e dell’intelligenza artificiale.

Fattori scatenanti:
  • Le deboli prospettive di Super Micro Computer Inc. e AMD hanno innescato un selloff sul Nasdaq 100.
  • Le borse statunitensi e asiatiche hanno seguito con perdite diffuse.
Fattori macro:
  • Lo shutdown del governo USA, ormai oltre 35 giorni, blocca la pubblicazione dei principali dati economici.
  • L’incertezza politica alimenta l’avversione al rischio e la volatilità dei mercati.
Outlook:
Il sentiment difensivo potrebbe persistere fino a una svolta politica o a un nuovo rally trainato dal settore tech.

FX: lo yen ritrova il ruolo di bene rifugio con la chiusura dei carry trade
  • Gli investitori rimpatriano capitali dalle valute ad alto rendimento verso lo yen, che si rafforza.
  • È un segnale di riduzione sistematica del rischio, tipico delle fasi di correzione più ampie.
  • A breve termine: i flussi difensivi verso lo yen dovrebbero continuare se la propensione al rischio resta debole.

USD/JPY, Grafico H4 | Fonte: Ultima Markets MT5

Focus tecnico: livelli chiave del Nasdaq 100
  • Attuale: correzione in corso, test di supporti tecnici.
  • Supporto chiave: 25.000 (orizzontale + bordo inferiore del canale ascendente)
    • Sopra 25.000 → struttura rialzista ancora valida.
    • Sotto 25.000 → rischio di correzione più profonda.
  • Da monitorare la reazione a 25.000 sui grafici giornaliero e H4.

Nasdaq 100, Grafico Giornaliero | Fonte: Ultima Markets MT5

Nasdaq 100, Grafico H4 | Fonte: Ultima Markets MT5


Sintesi e punti di attenzione
Driver della correzione:
sopravvalutazione tech, utili deludenti, stallo politico USA.
Segnale difensivo: la forza dello yen e la chiusura dei carry trade indicano modalità “risk-off”.
Trigger principali:
  • Un accordo sullo shutdown o nuove guidance dal settore tech potrebbero stabilizzare i mercati.
  • Nasdaq 100 sotto 25.000 = rischio di cali più rapidi.
  • USD/JPY: ulteriore forza dello yen se l’avversione al rischio persiste.
Discussione:
➔ Comprereste il Nasdaq sul supporto o aspettereste una conferma di fondo?
➔ Considerate lo yen come rifugio o vi coprite con altri strumenti?
➔ Cosa vi renderebbe di nuovo rialzisti sui mercati globali?
 

Allegati

  • USDJPY.png
    USDJPY.png
    208,6 KB · Visite: 3
  • NASDAQ Daily.png
    NASDAQ Daily.png
    239,5 KB · Visite: 5
  • NASDAQ H4.png
    NASDAQ H4.png
    274,1 KB · Visite: 4
Correzione globale si approfondisce: sopravvalutazione tech, stallo politico e chiusura dei carry trade


Mercati azionari globali: forte calo dopo il rally dell’IA

Le borse mondiali registrano il peggior ribasso giornaliero degli ultimi mesi a causa dei timori di sopravvalutazione nel settore tecnologico e dell’intelligenza artificiale.

Fattori scatenanti:
  • Le deboli prospettive di Super Micro Computer Inc. e AMD hanno innescato un selloff sul Nasdaq 100.
  • Le borse statunitensi e asiatiche hanno seguito con perdite diffuse.
Fattori macro:
  • Lo shutdown del governo USA, ormai oltre 35 giorni, blocca la pubblicazione dei principali dati economici.
  • L’incertezza politica alimenta l’avversione al rischio e la volatilità dei mercati.
Outlook:
Il sentiment difensivo potrebbe persistere fino a una svolta politica o a un nuovo rally trainato dal settore tech.

FX: lo yen ritrova il ruolo di bene rifugio con la chiusura dei carry trade
  • Gli investitori rimpatriano capitali dalle valute ad alto rendimento verso lo yen, che si rafforza.
  • È un segnale di riduzione sistematica del rischio, tipico delle fasi di correzione più ampie.
  • A breve termine: i flussi difensivi verso lo yen dovrebbero continuare se la propensione al rischio resta debole.

USD/JPY, Grafico H4 | Fonte: Ultima Markets MT5

Focus tecnico: livelli chiave del Nasdaq 100
  • Attuale: correzione in corso, test di supporti tecnici.
  • Supporto chiave: 25.000 (orizzontale + bordo inferiore del canale ascendente)
    • Sopra 25.000 → struttura rialzista ancora valida.
    • Sotto 25.000 → rischio di correzione più profonda.
  • Da monitorare la reazione a 25.000 sui grafici giornaliero e H4.

Nasdaq 100, Grafico Giornaliero | Fonte: Ultima Markets MT5

Nasdaq 100, Grafico H4 | Fonte: Ultima Markets MT5


Sintesi e punti di attenzione
Driver della correzione:
sopravvalutazione tech, utili deludenti, stallo politico USA.
Segnale difensivo: la forza dello yen e la chiusura dei carry trade indicano modalità “risk-off”.
Trigger principali:
  • Un accordo sullo shutdown o nuove guidance dal settore tech potrebbero stabilizzare i mercati.
  • Nasdaq 100 sotto 25.000 = rischio di cali più rapidi.
  • USD/JPY: ulteriore forza dello yen se l’avversione al rischio persiste.
Discussione:
➔ Comprereste il Nasdaq sul supporto o aspettereste una conferma di fondo?
➔ Considerate lo yen come rifugio o vi coprite con altri strumenti?
➔ Cosa vi renderebbe di nuovo rialzisti sui mercati globali?
Mi manca onestamente dove sia avvenuta sta correzione globale.
Dico sul serio
 
Bank of England rate decision: The latest big move – is sterling in danger of collapse?

The dilemma in short

  • Inflation: still high at 3.8% on an annual basis (September).
  • GDP: almost flat – a rate cut would be needed to stimulate growth.
  • Risk: An early cut could reignite inflation – better to hold or raise.
What the market predicts
  • Net split: Swap contracts and bookmakers are 50/50.
Main scenarios:
  1. Rate unchanged at 4.00% → signal to pay attention to inflation → pound slightly higher.
  2. 25bp cut to 3.75% → BoE more focused on growth → GBP/USD falls as differential with US widens.
  3. Rate unchanged but dovish tone → signal of imminent cuts → pound progressively weaker.
Technical analysis – bearish scenario

GBP/USD Daily Chart | Source: Ultima Markets MT5

  • Clear break of 1.3180.
  • New 7-month low.
  • As long as it remains below 1.3180–1.3200, the bears are in control.
  • Key supports: 1.3000 (psychological) and 1.2850 (August 2024 low).
Macro context – the dollar remains king
  • USDX: Near yearly highs.
  • Fed: rate cut with a cautious tone (“we will proceed with caution”).
  • US data: ADP very strong (+42k vs. +22k expected).
  • Safe haven flows: Strengthening the dollar.

USDX, 4-hour chart | Source: Ultima Markets MT5

Conclusion on GBP/USD:

Even if there's a temporary rally after a "no cut," the main trend remains bearish.
Many desks view any bounce toward 1.3250–1.3300 as a selling opportunity.

What to watch at 12:00 GMT:
  • Composition of the vote (8-1 more hawkish or 6-3 more dovish).
  • Language on “gradual withdrawal of restraint”.
  • Bailey Conference: Any hint of “start of easing cycle” could push the pound to 1.30.

Discussion:
➔ Will BoE hold or cut by 25bp?
➔ Where do you set your stop if you're short Cable?
➔ With a 50bp cut, where do you see GBP/USD closing by Friday?
➔ Anyone brave enough to stay long on the pound?
 

Allegati

  • USDX.png
    USDX.png
    234,2 KB · Visite: 3
  • GBPUSD.png
    GBPUSD.png
    236 KB · Visite: 3
Global correction intensifies on overvaluation fears – yen rises as risk aversion grows

Market Overview: Tech Selloff Increases Volatility

Global stock markets fell sharply.
  • Nasdaq -1.9%, S&P 500 -1.1% on fears of overvaluation among tech and AI giants.
  • Disappointing quarterly results from AMD and Super Micro Computer have accelerated sales.
  • The VIX index jumped higher, signaling a return to defensive positions.
Market Breadth:
The faltering mega-cap rally leaves indices more exposed to profit-taking and risk-off flows.

VIX Index.png

VIX Index, Daily Chart | Source: Ultima Market MT5

Yen rises on safe-haven demand
USD/JPY:

  • It fell from multi-month highs of 153.40 to below 153.00 – the sharpest decline in weeks.
  • Typical carry trade unwind : investors close yen-financed positions, fueling the currency's strength.
FX Dynamics:
A strengthening yen often accompanies stock market declines, amplifying volatility in global markets.

NASDAQ YEN FUTURES.png

Nasdaq Futures vs Yen Futures | Source: Ultima Market, Chart: Trading View

Technical Analysis – Key Levels in Forex

USD/JPY

  • Support: 153.30–153.00 (crucial zone)
  • Bearish trigger: A close below 153.00 could open room for further declines, especially with US yields falling.
  • Caution: Yen strength likely to last as long as market pressure remains high.
USDJPY.png

USD/JPY Daily Chart | Source: Ultima Market MT5

GBP/JPY
  • It fell below 200.00; the recovery of 201.00 failed.
  • Subsequent support: 198.00
  • Outlook: Very sensitive to global risk; further gains in the yen could weigh on the currency pair.
GBPJPY.png

GBP/JPY, 4-hour chart | Source: Ultima Market MT5

Conclusion and points of attention
  • Risk scenario: fragile. Overvaluation, high volatility, and a strong yen point to widespread de-risking.
  • Carry trade: the unwinding process will continue until a “risk-on” climate re-emerges.
  • Focus: US macro data, politics, and bond yields. Volatility will rise if sentiment remains negative.
Discussion:
➔ Are you betting on yen strength or waiting for signs of a reversal?
➔ What are the next support levels for global indices?
➔ Is this the end of the tech rally or a healthy pause?
 
End of shutdown improves sentiment, but lack of data keeps markets on alert

US Shutdown: Hope vs. Uncertainty.
Optimism in Recovery:


  • US futures (S&P 500, Nasdaq-100) gained more than 0.5% in Asia, as Senate Republicans pushed for a budget deal.
  • Every step toward ending the shutdown supports short-term risk.
But problems remain:
  • Even after reopening, the lack of official data persists: reports such as retail sales are still delayed.
  • The market remains cautious, sensitive to surprises and political headlines.
US Equities: Valuation Risk and the Technical Picture
Tech/AI:
Concerns about elevated valuations remain despite the rebound in futures.

S&P 500 (technical):
  • Sharp bounce near the support at 6700 and the bottom of the channel.
  • Uptrend as long as 6700 holds.
  • Levels to watch: Resistance at recent highs, support at 6700.
  • Possible pause in rebound if disappointing news persists or data is delayed.
SP500.png

S&P 500 Daily Chart | Source: Ultima Markets MT5

Bank of Japan: Divided on Next Step
  • Moderate majority: prefers to wait and monitor wage sustainability.
  • Hawkish minority: calls for immediate tightening as inflation remains above 2%.
  • Impact on the yen: moderates prevail, therefore pressure on the yen in the medium term barring any hawkish surprises.

Dollar and Gold: Sideways Phase
US Dollar (DXY):

  • Below 100, it trades between 99.00 and 100.00.
  • A catalyst (data or Fed signals) is needed for clear direction.
USD/JPY:
  • Down, supported by safe-haven demand for the yen.
  • Technical focus: watch out for movements below the H4 supports.
USDJPY.png

USD/JPY, H4 Chart | Source: Ultima Markets MT5

Gold (XAU/USD):
  • Support: Solid base between 3,900 and 4,000; closed above 4,000 last week.
  • Short term: 4,000–4,030 hours key area.
  • Outlook: Bullish bias above 4,000; below that level, there is a risk of a correction.
Summary and discussion
  • Sentiment: Positive in the short term due to progress on the shutdown, but the lack of data weighs on confidence.
  • Technical picture: S&P 500 bullish above 6,700, gold stable above 4,000, dollar in tight range.
  • To watch: BoJ, US economic calendar, political developments.
Discussion:
➔ Are you buying the rebound or waiting for new data?
➔ Where do you see the S&P 500 going if the shutdown ends but data remains pending?
➔ Is gold still your preferred hedge in this environment?
 

Users who are viewing this thread

Back
Alto