Stai usando un browser molto obsoleto. Puoi incorrere in problemi di visualizzazione di questo e altri siti oltre che in problemi di sicurezza. .
Dovresti aggiornarlo oppure usarne uno alternativo, moderno e sicuro.
Dovresti aggiornarlo oppure usarne uno alternativo, moderno e sicuro.
ETC Natural Gas
- Creatore Discussione NEO_99
- Data di Inizio
NEO_99
Forumer storico
La Apple in questi giorni ha guidato i ribassi passando dal suo record storico di circa 640$ a 560$ (chiusura di ieri sera ) ..poi nel dopo borsa ha diffuso i dati ..utili in crescita del 92% battendo le stime di oltre 2$ ....effetto??.. un rialzo in after di 43$ a 603$
Gli USA avranno 1000 difetti... ma vuoi vedere che i nostri son ben peggiori...?
Gli USA avranno 1000 difetti... ma vuoi vedere che i nostri son ben peggiori...?
mavtop
Forumer storico
cosi e' l'america, magari entri SHORT su un titolo e ti riapre sopra di un 10%, ma almeno loro confermano le notizie, se brutte cade, se belle sale, il gas purtroppo fa un po' a modo suo anche se le scorte sono quello che veramente conta
se ci riesco nel pomeriggio aggiungo qualche altro grafico")
se ci riesco nel pomeriggio aggiungo qualche altro grafico
mavtop
Forumer storico
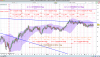
Crude Oil Future
situazione crude:
Siamo alla 28a barra (compresa oggi) del 2o mensile del 2o intermedio (considerando l'annuale iniziato il 5 ott 2011 vedere allegato con gli annuali)
Praticamente siamo nel 2o Tracy (6-8gg) del 2o T+1 (12-16gg) del mensile in atto, tale ciclo DEVE ESSERE AL RIBASSO per considerarlo parte integrante del mensile attuale che E' AL RIBASSO, infatti il primo T+1 e' stato in configurazione ribassista, questo implica che tutti i successivi T+1 presenti nel mensile DEVONO essere ribassisti.
Quindi mi aspetto che a breve il secondo Tracy (6-8gg) iniziato il 24 aprile inizii a scendere per terminare sotto il minimo di partenza posto a 100,68 (del 10 aprile).
Mi aspetto quindi dal 1 al 4 Maggio un nuovo minimo < a 100,68$.
Dall'analisi inversa invece mi aspetto un TOP sul ciclo attuale tra oggi e domani a conclusione del Tracy inverso in atto cmq non superiore a 104,68$.
Se questo non fosse rispettato allora dovremmo considerare il T+1 precedente all'attuale come parte a se stante o facente parte del 1o mensile dell'intermedio in atto.
Come target di arrivo di questo intermedio vedrei bene area 98,3$ (conti fatti con elliott) ma potremmo scendere anche piu' sotto.
Ho messo anche una mia "visione" (e lasciatemela chiamare cosi in quanto non sono un espertissimo di elliott) elliottiana sul crude.
Anzi se qualcuno piu' ferrato di me volesse aggiungere qualcosa gliene sarei grato.
Aggiungo che il T+4 (semestrale) ha gia iniziato la sua inversione, infatti abbiamo avuto un T+1 ribassista nella sua 2a meta' (dopo barra 64, spero di aver indovinato Elico64) questo potrebbe essere un campanello di allarme per la sua prosecuzione LONG.
Allegati

Ultima modifica:
NEO_99
Forumer storico
Natural gas futures swung between small gains and losses during European morning trade on Wednesday, as market participants focused on weather forecasts to gauge the strength of demand for the fuel.
On the New York Mercantile Exchange, natural gas futures for delivery in May traded at USD1.977 per million British thermal units during European morning trade, dipping 0.1%.
The May contract is due to expire at the end of trade on Thursday, April 26.
Meanwhile, the more actively traded contract for June delivery added 0.3% to trade at USD2.069 per million British thermal units.
Natural gas traders continued to monitor extended weather forecasts across the U.S., which could potentially lead to some late-season demand for the heating fuel.
Prices surged by more than 4% on Monday, after a late-season storm brought heavy rain and even snow to certain areas of the East Coast.
The harsh weather was expected to persist, with the National Weather Service calling for heavy snow through Tuesday in western New York, west-central Pennsylvania and northeast West Virginia.
However, prices resumed their downward trend on Tuesday, as investors grew skeptical that the late-season winter storm will put a dent in record-high U.S. supplies.
Weekly storage data from the U.S. released last week showed that natural gas storage in the U.S. rose by 25 billion cubic feet last week, the fifth consecutive seasonal injection of natural gas for the year.
Total U.S. natural gas storage stood at 2.512 trillion cubic feet as of last week, a record high for this time of year and almost 58% higher than the five-year average for this time of year.
Early injection estimates for Thursday’s storage data range from 35 billion cubic feet to 75 billion cubic feet, compared to last year's build of 35 billion cubic feet. The five-year average change for the week is an increase of 47 billion cubic feet.
Current inventories are at levels they didn't reach last year until the end of June. Concerns are growing over whether enough capacity exists to store the fuel.
If weekly stock builds through October match the five-year average, inventories would top out at 4.594 trillion cubic feet, 12% over peak capacity estimates of about 4.1 trillion cubic feet.
Market analysts expect the downtrend to continue, with some traders expecting futures to fall to USD1.850 in the short-term. Prices fell to USD1.902 per million British thermal units last Friday, the lowest since September 26, 2001.
Natural gas futures have been hitting a string of fresh 10-year lows below the key USD2.00-level over the past two weeks, as market sentiment has been dominated by ongoing concerns over waning demand and elevated U.S. storage and production levels.
Natural gas prices have plunged almost 25% since the beginning of March and are down nearly 35% since the start of 2012.
Elsewhere on the NYMEX, light sweet crude oil futures for delivery in June rose 0.5% to trade at USD104.08 a barrel, while heating oil for June delivery added 0.5% to trade at USD3.150 per gallon.
NEO_99
Forumer storico
(Reuters) - Natural gas futures held modest gains on Wednesday, as chilly weather in the Northeast and Midwest and steady gains in coal-to-gas switching helped boost demand despite milder extended forecasts and concerns about record-high supplies.
Traders noted cool weather this week from New York to Chicago has stirred more heating load, while warm temperatures in Texas and parts of the South triggered some cooling demand.
Low gas prices have also prompted more utilities to switch from coal to cheaper gas to generate power, adding as much as 8 billion cubic feet, or about 10 percent, to daily gas demand versus last year's levels.
"The market may be getting close to a bottom. Temperature-adjusted storage injections have been very low (bullish), which could help whittle down the (inventory) surplus pretty quickly," said Kyle Cooper, managing director of research at IAF Advisors in Houston.
At 1:15 p.m. EDT (1715 GMT), front-month gas futures on the New York Mercantile Exchange were up 5.9 cents, or 3 percent, at $2.034 per million British thermal units after trading between $1.971 and $2.044.
The near contract hit $1.902 on Thursday, its lowest since January 2002.
Rising demand has kept Henry Hub cash prices relatively firm, with the Hub up 17 cents this week and trading at a fairly strong differential at about flat or slightly over futures.
But despite recent attempts to move higher, many traders expect renewed pressure on prices with supplies still at record highs and forecasts looking more moderate next week.
AccuWeather.com expects temperatures in the Northeast and Midwest, key gas-consuming regions, to average below normal this week, but above-normal readings are forecast for both regions next week.
STORAGE PRESSURES PRICES
Utilities typically build inventories from April through October to help meet peak winter heating needs.
U.S. Energy Information Administration data last week showed domestic gas inventories for the week ended April 13 climbed to 2.512 trillion cubic feet, easily a record for this time of year. (Storage graphic: link.reuters.com/mup44s)
EIA storage data on Thursday is expected to show gas inventories rose last week by 47 bcf, a build that would increase the surplus to last year and leave the excess to the five-year average unchanged at more than 900 bcf, or 56 percent.
Such a huge cushion could help meet any spikes in demand or storm-related disruptions in supply this year.
Concerns are growing that the inventory glut will drive prices lower this spring as seasonal weather demand fades and pressure prices again this summer as storage caverns fill and force more gas into an over-supplied market.
If weekly stock builds through October match the five-year average, inventories would top out at 4.594 tcf, 12 percent over peak capacity estimates of about 4.1 tcf.
Injection estimates for Thursday's EIA report range from 35 bcf to 69 bcf, with most in the low to mid-50s. Stocks rose an adjusted 35 bcf in the same week last year, while the five-year average build for that week is 47 bcf.
PRODUCTION AT OR NEAR RECORD HIGHS
Baker Hughes data last week showed the U.S. gas-directed rig count rose by seven to 631, only the third gain this year. The count hit a 10-year low two weeks ago.
(Graphic on rigs vs prices: r.reuters.com/dyb62s )
The nearly steady drop in dry gas drilling -- the gas rig count is down a third since peaking last year at 936 in October -- has raised expectations that producers were finally getting serious about stemming the flood of record dry gas supplies.
But the cuts have not been reflected in pipeline flows, which are still estimated at or near record-high levels.
Analysts say any slowdown in dry gas output could take a lot more time, noting increased drilling in more-profitable shale oil and shale liquids prospects still produces plenty of associated gas that ends up in the market after processing.
The EIA expects output in 2012 to climb by 3 bcf per day, or 4.5 percent, to a record 69.22 bcfd.
TIGHTENING MARKET
Gas prices have been hovering near 10-year lows and helped tighten the market this year.
Coal-to-gas switching has offered the best chance of burning up some of the excess supply. Some analysts estimate there could be another 2 bcfd of potential switching if gas prices fall into the $1.60s or $1.70s.
Cheap gas prices have also drawn more interest from energy-intensive industries such as petrochemicals, steel and paper. Demand from the industrial sector is estimated to be up about 0.5 bcf per day this year.
Sgasato
Forumer attivo
Per mavtop
Ciao Mav,
ho sempre professato ignoranza in materia e questo mi rende ancora piu' tapino rispetto alle cifre assurde che sto perdendo (anzi che ho gia' perso) in borsa , ma alla luce dell'analisi molto dettagliata che hai fatto il 24 aprile su Intesa e il Gas, cosa dice l'analisi tecnica, cioe' mi sembrava di aver capito che il Gas e Intesa a tutto erano pronti tranne che a salire e invece , il gas in particolare, ha avuto una bella erezione...ma il t1 o t9 e quant' altro non era palesemente al ribasso ?
Non e' ironia volevo solo capirne di piu' perche' anche il Barcellona e il Real dovevano essere in finale d Champions ma ora sono a casa e li i motivi li capisco, qui no
Similar threads
- Risposte
- 8
- Visite
- 630
- Risposte
- 11
- Visite
- 756
- Risposte
- 8
- Visite
- 352
- Risposte
- 1
- Visite
- 300
Users who are viewing this thread
Total: 1 (members: 0, guests: 1)