SEI DA OSCAR grande!! lo rileggo!!
mica è mio . io l'ho solo copiato

l'originale
One of the big market stories earlier this year was about the outsized and LTRO-fueled rally enjoyed by the financials with the sector climbing 33% in less than three months.
Less noted, however, is the fact that unlike the Dow Jones Industrial Average, Nasdaq Composite and S&P 500, the XLF did not carve out new multi-year highs on this run up with a possible peak to the three-year cyclical bull market having been made in the summer of 2011 similar to the Dow Transports and the Russell 2000.
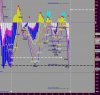
This is worth noting now considering that the chart of the XLF looks oddly as it did last summer prior to the correction in August with a series of Bull and Falling Wedges creating a trend of three lower highs.
This string of lower highs is not as strong as last year’s bearish tell on the XLF’s peak to trough move down of nearly 40% in just eight months, but it is worth thinking about considering that it reflects the reversal of the XLF’s intermediate-term uptrend as an expression of its major Rising Wedge fulfilling toward its target of $10.95.
Interestingly, however, the XLF’s near-term trend did turn up, even though it is probably on a multi-week bearish Rising Wedge formed over the last nearly two months, and this is something that did not occur last year due to that very convincing trend of lower highs.
It is challenging to view this near-term uptrend as anything but artificially and temporarily bullish considering that the XLF’s two-year trend is down as its one-year uptrend is reversing down with the near-term uptrend unlikely to overtake the strong reversal down that started in late March.
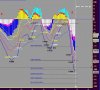
Rather than leave this bull and bear battleground up to conjecture, though, let’s just turn it over to the levels that will decide this sideways fight and those are provided by the Bull and Bear Fan Lines in the chart on the following page.
Perhaps surprisingly, it is the descending trendlines in gray and green that comprise the XLF’s Bull Fan Lines while the ascending trendlines in gray, blue and red form the XLF’s Bear Fan lines and it is the XLF’s position squarely in-between the outside trendline for each set that shows just how sideways the XLF truly is right now.
This neutral positioning will remain untill the XLF trades above the green Bull Fan Line to prove a reversal of the XLF’s long-term downtrend or below the red Bear Fan Line to demonstrate a reversal of the XLF’s intermediate-term uptrend.
Put otherwise, it seems that the XLF is likely to coil between about $14 and $15.50 for another few days to weeks before it makes a decisive move up or down and it is this big break-to-come that makes playing that range dangerous due to the violence of that move when it comes that requires a convincing close breach of one of those two levels that are converging. Most technical indications – its multi-week and multi-month Rising Wedge, possible H&S and a small Diamond Top – suggest it will be to the downside right now and a possibility that seems to match the uncertain shadow over the financials in the form of trading losses, Dodd Frank, the LIBOR scandal and all of this before what may turn out to be the real stress on the global financial system and that is the sovereign debt and banking crisis in Europe.
It seems, then, that the XLF is stuck in the middle right now but that this sideways stance won’t be around for too long.
As always, thank you for taking the time to catch up on my thinking.