FTSE Mib Futures solointraday - Cap. 2 (2 lettori)

Stato
Chiusa ad ulteriori risposte.

Guglia was Gulliver

Forumer storico
una analisi interessante sul comparto finanziario usa


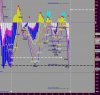
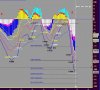
Una delle storie grandi del mercato all'inizio di quest'anno era di circa il rally fuori misura e ORLT-alimentato di cui godono i dati finanziari con il settore salire del 33% in meno di tre mesi. meno noti, tuttavia, è il fatto che a differenza del Dow Jones Industrial Average, Nasdaq Composite e S & P 500, il XLF non ritagliarsi nuovi pluriennali highs su questo percorso con un picco di possibile ai tre anni di bull market ciclico sia stata presentata in estate del 2011 simile ai Trasporti Dow e il Russell 2000 . Questo è degno di nota se si considera che ora il grafico del XLF sembra stranamente come ha fatto la scorsa estate prima che la correzione nel mese di agosto con una serie di Bull e cunei in calo la creazione di un trend di tre massimi inferiori .


Questa stringa di minori alti non è forte come il pensiero ribassista dire sulla vetta del XLF di muoversi attraverso verso il basso di circa il 40% in soli otto mesi, ma vale la pena lo scorso anno a proposito visto che rispecchia l'inversione di XLF di medio termine uptrend come espressione della sua Wedge importante aumento adempimento verso il suo obiettivo di $ 10.95. interessante notare, tuttavia, la XLF, vicino a termine la tendenza si presentò, anche se probabilmente è un multi-settimana Wedge ribassista Levante formata nel corso degli ultimi quasi due mesi, e questo è qualcosa che non si è verificato lo scorso anno a causa di questa tendenza molto convincente di minori alti. E 'una sfida per visualizzare questa breve termine uptrend come qualcosa di artificiale e temporaneamente rialzista considerando che la XLF di due anni tendenza è verso il basso come uno anni di trend rialzista sta ribaltando giù con il breve termine trend rialzista difficilmente a superare l'inversione forte verso il basso che è iniziato a fine marzo. Piuttosto che lasciare il toro e battaglia bear fino a congetture, però, facciamo solo girare ai livelli che decideranno questa lotta di lato e quelli sono fornite dal Bull e Lines Fan Orso nella tabella alla pagina seguente. Forse sorprendentemente, sono le linee di tendenza discendente in grigio e verde che comprendono linee di Fan del XLF di Bull, mentre le linee di tendenza ascendente in grigio, blu e modulo rosso del XLF le linee Fan Bear e che è la posizione del XLF ha retto in-tra la linea di tendenza al di fuori di ogni set che dimostra quanto lateralmente la XLF è davvero in questo momento.


Questo posizionamento neutro rimarrà finchè i mestieri XLF sopra la linea verde Fan Bull per dimostrare un'inversione di XLF a lungo termine tendenza al ribasso o al di sotto della linea rossa Fan Orso per dimostrare un'inversione di XLF di medio termine trend rialzista. Detto in altri termini, sembra che il XLF è probabile che alla bobina tra i circa $ 14 e $ 15.50 per qualche giorno o settimane prima che fa una mossa decisiva verso l'alto o verso il basso ed è questo break-venire-grande che rende il gioco che spaziano pericolosa a causa della violenza di che si muovono quando si richiede che una violazione convincente stretto di uno di questi due livelli che sono convergenti. Indicazioni più tecniche - la zeppa multi-settimana e multi-mese Rising, possibile H & S e una Top piccolo diamante - suggeriscono che sarà al ribasso in questo momento e la possibilità che sembra coincidere con l'ombra incerta sui finanziari sotto forma di commercio perdite, Frank Dodd, lo scandalo LIBOR e tutto questo prima di quello che potrebbe rivelarsi lo stress reale sul sistema finanziario globale e che è il debito sovrano e crisi bancaria in Europa. Sembra, quindi, che la XLF è bloccato in di centro-destra, ma ora che questa posizione laterale non sarà in giro per troppo tempo. Come sempre, vi ringrazio per il tempo di recuperare il mio pensiero.

SEI DA OSCAR grande!! lo rileggo!!
 

ironclad

Pitchfork + Harmonic patterns

Allegati

  • images (1).jpg
    images (1).jpg
    9,8 KB · Visite: 215

solointraday

Forumer storico
coi falsari mai dire mai, e bisogna stare sempre all'erta con le lower shadows da manina magica che inverte tutto, però qualche paletto lo possiamo fissare:il broadening di lungo rosso, la wedge ribassista con cui avrebbe fatto quella che ancora potrebbe essere una 2 o 4 correttiva a seconda dei conteggi, macd in divergenza negativa sul 4 ore, evening star formation daily ( almeno finora, ma se chiude così quello è un pattern che non necessita in teoria di conferme, ancor più perchè fatto a ridosso di una tlinedisc dai massimi dell'anno che è la parte alta di un broadening costruito in 4 mesi) ecc ecc
 
Ultima modifica:

solointraday

Forumer storico
SEI DA OSCAR grande!! lo rileggo!!
mica è mio . io l'ho solo copiato :D

l'originale

One of the big market stories earlier this year was about the outsized and LTRO-fueled rally enjoyed by the financials with the sector climbing 33% in less than three months.

Less noted, however, is the fact that unlike the Dow Jones Industrial Average, Nasdaq Composite and S&P 500, the XLF did not carve out new multi-year highs on this run up with a possible peak to the three-year cyclical bull market having been made in the summer of 2011 similar to the Dow Transports and the Russell 2000.

This is worth noting now considering that the chart of the XLF looks oddly as it did last summer prior to the correction in August with a series of Bull and Falling Wedges creating a trend of three lower highs.


This string of lower highs is not as strong as last year’s bearish tell on the XLF’s peak to trough move down of nearly 40% in just eight months, but it is worth thinking about considering that it reflects the reversal of the XLF’s intermediate-term uptrend as an expression of its major Rising Wedge fulfilling toward its target of $10.95.

Interestingly, however, the XLF’s near-term trend did turn up, even though it is probably on a multi-week bearish Rising Wedge formed over the last nearly two months, and this is something that did not occur last year due to that very convincing trend of lower highs.

It is challenging to view this near-term uptrend as anything but artificially and temporarily bullish considering that the XLF’s two-year trend is down as its one-year uptrend is reversing down with the near-term uptrend unlikely to overtake the strong reversal down that started in late March.

Rather than leave this bull and bear battleground up to conjecture, though, let’s just turn it over to the levels that will decide this sideways fight and those are provided by the Bull and Bear Fan Lines in the chart on the following page.

Perhaps surprisingly, it is the descending trendlines in gray and green that comprise the XLF’s Bull Fan Lines while the ascending trendlines in gray, blue and red form the XLF’s Bear Fan lines and it is the XLF’s position squarely in-between the outside trendline for each set that shows just how sideways the XLF truly is right now.


This neutral positioning will remain untill the XLF trades above the green Bull Fan Line to prove a reversal of the XLF’s long-term downtrend or below the red Bear Fan Line to demonstrate a reversal of the XLF’s intermediate-term uptrend.

Put otherwise, it seems that the XLF is likely to coil between about $14 and $15.50 for another few days to weeks before it makes a decisive move up or down and it is this big break-to-come that makes playing that range dangerous due to the violence of that move when it comes that requires a convincing close breach of one of those two levels that are converging. Most technical indications – its multi-week and multi-month Rising Wedge, possible H&S and a small Diamond Top – suggest it will be to the downside right now and a possibility that seems to match the uncertain shadow over the financials in the form of trading losses, Dodd Frank, the LIBOR scandal and all of this before what may turn out to be the real stress on the global financial system and that is the sovereign debt and banking crisis in Europe.

It seems, then, that the XLF is stuck in the middle right now but that this sideways stance won’t be around for too long.

As always, thank you for taking the time to catch up on my thinking.
 

DRIVE

Massaio di Voghera
ore 15 ed ore 16

siamo fuori dal limite degli ultimi due MESI..cioe' short short..si, ma con questi 4 gatti di fib????

138%

puzza

tenti ad esagerare..macari vi va bene ..pero' statistica contro
 

Allegati

  • Capture_17.jpg
    Capture_17.jpg
    189,4 KB · Visite: 196
  • Capture_18.jpg
    Capture_18.jpg
    132,8 KB · Visite: 191
Stato
Chiusa ad ulteriori risposte.

Users who are viewing this thread

Alto