Portafogli e Strategie (investimento) Sunset Boulevard: the Indian Summer of the debt (Vol. VI)

  • Creatore Discussione Creatore Discussione Imark
  • Data di Inizio Data di Inizio
iShares Markit iBoxx Euro High Yield (IHYG) | All Fund Holdings | iShares United Kingdom ETFs (Exchange Traded Funds) | Retail Client

DAILY_HOLDINGS
logo_ishares.gif


iShares Markit iBoxx Euro High Yield (IHYG)


  • Please note that the data on this page uses the following information to define the results:

    As at: 28/10/10 27/10/10 26/10/10 25/10/10 22/10/10 21/10/10 20/10/10 19/10/10 18/10/10 15/10/10 14/10/10 13/10/10 12/10/10 11/10/10 08/10/10 07/10/10 06/10/10 05/10/10 04/10/10 01/10/10 30/09/10 29/09/10 28/09/10 27/09/10 24/09/10 23/09/10 22/09/10 21/09/10 20/09/10 17/09/10 16/09/10 15/09/10 14/09/10 13/09/10 10/09/10 09/09/10 08/09/10 07/09/10 06/09/10 03/09/10
  • Holdings Summary28/10/10

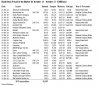
    Ticker IHYG Total Net Assets (000) 161,980 Number of Holdings 173 Currency EUR
  • All Holdings

    28/10/10 % Weight Security ISIN SEDOL Price Country Sector Coupon Maturity Moody's Rating 1.63 UNITYMEDIA HESSEN / NRW RegS 8.125 12/01/2017 XS0468492219 B442PX7 105.00 Germany Industrial 8.12 01/12/17 B1 1.54 FCE BANK PLC MTN 7.125 01/16/2012 XS0282593440 B1MY5X4 104.00 UK Industrial 7.12 16/01/12 Ba2 1.45 WIND ACQUISITION FINANCE RegS 11.75 07/15/2017 XS0438150160 B3LGQN2 112.75 Luxembourg Industrial 11.75 15/07/17 B2 1.41 EVONIK DEGUSSA GMBH 5.125 12/10/2013 XS0181557454 B034J01 105.66 Germany Industrial 5.12 10/12/13 NR 1.40 FCE BANK PLC MTN 7.125 01/15/2013 XS0299967413 B1WVN08 106.00 UK Industrial 7.12 15/01/13 Ba2 1.35 INEOS GROUP HOLDINGS PLC RegS 7.875 02/15/2016 XS0242945367 B0XZ3F7 88.50 UK Industrial 7.88 15/02/16 Caa2 1.34 STORA ENSO OYJ MTN 5.125 06/23/2014 XS0194948617 B01NFJ1 104.02 Finland Industrial 5.12 23/06/14 Ba2 1.31 PERNOD-RICARD SA 4.875 03/18/2016 FR0010871376 B3NBY53 101.88 France Industrial 4.88 18/03/16 Ba1 1.28 FIAT FINANCE AND TRADE LTD. RegS 9 07/30/2012 XS0442431564 N/A 108.73 Luxembourg Industrial 9.00 30/07/12 Ba1 1.25 HEIDELBERGCEMENT AG RegS 8 01/31/2017 XS0458230322 B54VQQ1 105.99 Germany Industrial 8.00 31/01/17 B1 1.25 ZIGGO BOND COMPANY BV RegS 8 05/15/2018 XS0505541044 B3YW303 104.12 Netherlands Industrial 8.00 15/05/18 B2 1.14 ROYAL CARIBBEAN CRUISES LTD RegS 5.625 01/27/2014 XS0282330868 B1P1134 100.00 Liberia Industrial 5.62 27/01/14 Ba3 1.14 FIAT FINANCE AND T MTN 6.625 02/15/2013 XS0244126107 B0YJHZ6 105.62 Luxembourg Industrial 6.62 15/02/13 Ba1 1.09 EDCON PTY LTD RegS 4.129 06/15/2014 XS0304285280 B1YSZK1 82.90 South Africa Industrial 4.13 15/06/14 B2 1.07 FIAT FINANCE AND T MTN 7.625 09/15/2014 XS0451641285 B42FSC8 109.50 Luxembourg Industrial 7.62 15/09/14 Ba1 1.07 WIND ACQUISITION FINANCE SA RegS 11 12/01/2015 XS0236096730 B0R7MJ6 105.38 Luxembourg Industrial 11.00 01/12/15 B2 1.06 DEUTSCHE LUFTHANSA MTN 6.75 03/24/2014 XS0419185789 B65PBD1 110.27 Germany Industrial 6.75 24/03/14 Ba1 1.05 FRANZ HANIEL & CIE MTN RegS 6.75 10/23/2014 XS0459131636 B544K24 108.18 Germany Industrial 6.75 23/10/14 Ba1 1.03 GMAC INTERNATIONAL FINANCE BV 7.5 04/21/2015 XS0503684838 B5NR1P4 102.25 Netherlands Financial Institutions 7.50 21/04/15 B3 1.01 CONTI-GUMMI FINANC MTN RegS 7.5 09/15/2017 DE000A1A0U37 B675TS0 103.00 Netherlands Industrial 7.50 15/09/17 B1 0.95 BOMBARDIER INC RegS 7.25 11/15/2016 XS0273988393 B1HCJ53 104.75 Canada Industrial 7.25 15/11/16 Ba2 0.95 FIAT FINANCE AND T MTN 6.875 02/13/2015 XS0465889912 B59J7F6 107.13 Luxembourg Industrial 6.88 13/02/15 Ba1 0.91 AMERICAN GENERAL FINANCE CORPORATI 4.125 11/29/2013 XS0276697439 B1J5F63 84.75 United States Financial Institutions 4.12 29/11/13 B3 0.89 NXP BV 3.735 10/15/2013 XS0298436436 B1YBR93 94.50 Netherlands Industrial 3.74 15/10/13 Caa1 0.88 EVONIK INDUSTRIES AG RegS 7 10/14/2014 XS0456708212 B4V68R7 108.10 Germany Industrial 7.00 14/10/14 Ba1 0.87 PERNOD RICARD FINA MTN 7 01/15/2015 FR0010766329 B4YM0R6 110.36 France Industrial 7.00 15/01/15 Ba1 0.86 FRESENIUS FINANCE BV RegS 5 01/31/2013 XS0240918218 B0WHSC6 105.01 Netherlands Industrial 5.00 31/01/13 Ba1 0.85 CONTI-GUMMI FINANCE BV 8.5 07/15/2015 DE000A1AY2A0 B3WV3T1 108.25 Netherlands Industrial 8.50 15/07/15 B1 0.85 DEUTSCHE LUFTHANSA MTN 6.5 07/07/2016 XS0438813536 B3LCD62 110.95 Germany Industrial 6.50 07/07/16 Ba1 0.84 UNITYMEDIA GMBH RegS 9.625 12/01/2019 XS0468466056 B43YVZ8 108.25 Germany Industrial 9.62 01/12/19 B3 0.84 HEIDELBERGCEMENT AG 6.5 08/03/2015 XS0478802548 B5ZQDM0 104.05 Germany Industrial 6.50 03/08/15 B1 0.83 KERLIN PLC RegS 10.625 02/01/2017 XS0480857415 N/A 106.09 UK Industrial 10.62 01/02/17 B3 0.83 HEIDELBERGERCEMENT MTN 7.625 01/25/2012 XS0342136313 B2NSTW9 105.06 Netherlands Industrial 7.62 25/01/12 B1 0.83 FCE BANK PLC MTN 9.375 01/17/2014 XS0466777223 B5BF2B3 113.02 UK Industrial 9.38 17/01/14 Ba2 0.83 MOL MAGYAR OLAJ- E MTN RegS 5.875 04/20/2017 XS0503453275 B587450 96.40 Hungary Industrial 5.88 20/04/17 NR 0.81 REXEL SA 8.25 12/15/2016 XS0473749959 B544723 109.27 France Industrial 8.25 15/12/16 B1 0.80 CODERE FINANCE LUXEMBOURG SA RegS 8.25 06/15/2015 XS0222158767 B0BSD47 101.64 Luxembourg Industrial 8.25 15/06/15 B2 0.80 RENAULT SA MTN 6 10/13/2014 FR0010809236 B4T3D64 105.93 France Industrial 6.00 13/10/14 Ba1 0.77 WENDEL 4.875 11/04/2014 XS0203831432 B039467 98.10 France Industrial 4.88 04/11/14 NR 0.77 GROHE HOLDING GMBH RegS 3.86 01/15/2014 XS0282457349 B1N83D1 94.75 Germany Industrial 3.86 15/01/14 B3 0.77 LIGHTHOUSE INTERNATIONAL CO SA RegS 8 04/30/2014 XS0190027051 B00PNM7 53.00 Luxembourg Industrial 8.00 30/04/14 Caa1 0.76 FIAT FINANCE NORTH MTN 5.625 06/12/2017 XS0305093311 B1YLC65 103.65 United States Industrial 5.62 12/06/17 Ba1 0.76 HEIDELBERGCEMENT AG RegS 7.5 10/31/2014 XS0458230082 B557185 106.75 Germany Industrial 7.50 31/10/14 B1 0.75 OBRASCON HUARTE LA MTN 7.375 04/28/2015 XS0503993627 B3WG9K9 99.73 Spain Industrial 7.38 28/04/15 Ba2 0.73 CEMEX FINANCE EUROPE BV 4.75 03/05/2014 XS0289333048 B1SNL71 82.75 Netherlands Industrial 4.75 05/03/14 NR 0.72 NORDIC TELEPHONE CO HOLDING APS RegS 8.25 05/01/2016 XS0252438899 B13V2C2 105.50 Denmark Industrial 8.25 01/05/16 B1 0.71 GECINA MTN 4.5 09/19/2014 FR0010943316 B68QBM0 102.40 France Financial Institutions 4.50 19/09/14 Baa3 0.70 PEUGEOT SA 8.375 07/15/2014 FR0010780452 B3LMG29 113.07 France Industrial 8.38 15/07/14 Baa3 0.69 RENAULT S.A. MTN 4.375 05/24/2013 FR0010326942 B14ZS92 103.42 France Industrial 4.38 24/05/13 Ba1 0.69 RENAULT SA MTN 4.5 04/16/2012 FR0010459388 B1W0HW5 102.45 France Industrial 4.50 16/04/12 Ba1 0.69 RHODIA S.A. 7 05/15/2018 XS0506721827 B3QQXS1 106.75 France Industrial 7.00 15/05/18 B1 0.69 CHESAPEAKE ENERGY CORPORATION 6.25 01/15/2017 XS0273933902 B1KPKD4 102.50 United States Industrial 6.25 15/01/17 Ba3 0.68 MOL MAGYAR OLAJ GAZIPARI 3.875 10/05/2015 XS0231264275 B0LLBP3 92.75 Hungary Industrial 3.88 05/10/15 NR 0.68 DUBAI HOLDING COMM MTN 4.75 01/30/2014 XS0285303821 B1PGYV8 83.25 Cayman Islands Non - Corporate 4.75 30/01/14 B2 0.67 UPM-KYMMENE CORPOR MTN 6.125 01/23/2012 XS0142044824 7291658 104.81 Finland Industrial 6.12 23/01/12 Ba1 0.66 ISS HOLDING A/S RegS 8.875 05/15/2016 XS0253470644 B141964 104.50 Denmark Industrial 8.88 15/05/16 Caa1 0.66 RENAULT SA MTN 5.625 06/30/2015 FR0010916734 B3YJB77 103.89 France Industrial 5.62 30/06/15 Ba1 0.65 FRANZ HANIEL & CIE GMBH 5.875 02/01/2017 XS0482703286 B62DF03 105.51 Germany Industrial 5.88 01/02/17 Ba1 0.64 WENDEL INVESTISSEMENT 4.875 09/21/2015 XS0290422095 B1TK1Q0 97.50 France Industrial 4.88 21/09/15 NR 0.64 NEW WORLD RESOURCES NV RegS 7.875 05/01/2018 XS0504814509 B662XG8 103.74 Netherlands Industrial 7.88 01/05/18 Ba3 0.64 PERNOD-RICARD SA 4.625 12/06/2013 FR0010398271 B1J5QB5 103.35 France Industrial 4.62 06/12/13 Ba1 0.62 IMPRESS HOLDINGS BV RegS 4.11 09/15/2013 XS0257943893 B1FH1C1 99.50 Netherlands Industrial 4.11 15/09/13 Ba3 0.62 SMURFIT KAPPA ACQUISITIONS RegS 7.75 11/15/2019 XS0467785613 B5876K9 106.00 Ireland Industrial 7.75 15/11/19 Ba2 0.62 UPCB FINANCE LTD RegS 7.625 01/15/2020 XS0479955402 B3PDYY6 104.25 Cayman Islands Industrial 7.62 15/01/20 Ba3 0.61 MONDI FINANCE LTD 5.75 04/03/2017 XS0499542396 B561KM3 102.17 UK Industrial 5.75 03/04/17 Baa3 0.61 UPC HOLDING BV RegS 9.75 04/15/2018 XS0425443370 B3ZBTZ6 107.25 Netherlands Industrial 9.75 15/04/18 B2 0.60 M-REAL OYJ 8.75 04/01/2013 XS0249583377 B123WG3 105.75 Finland Industrial 8.75 01/04/13 B3 0.60 FRESENIUS FINANCE BV RegS 5.5 01/31/2016 XS0240919372 B0WHV61 104.75 Netherlands Industrial 5.50 31/01/16 Ba1 0.60 UPC HOLDING BV RegS 8.375 08/15/2020 XS0532178000 B4Z9T35 101.25 Netherlands Industrial 8.38 15/08/20 B2 0.60 HEIDELBERGCEMENT AG 7.5 04/03/2020 XS0478803355 B612G64 103.43 Germany Industrial 7.50 03/04/20 B1 0.59 PROLOGIS INTERNATIONAL FUNDING SA 7.625 10/23/2014 XS0326896718 B28PFJ4 105.50 Luxembourg Financial Institutions 7.62 23/10/14 Ba1 0.59 ABENGOA SA MTN 8.5 03/31/2016 XS0498817542 B53Q3F5 98.51 Spain Industrial 8.50 31/03/16 NR 0.58 TDC AS MTN 6.5 04/19/2012 XS0146556385 7344091 105.38 Denmark Industrial 6.50 19/04/12 Ba3 0.57 CLARIANT FINANCE LUXEMBOURG SA 4.375 04/05/2013 XS0249417014 B120M53 102.33 Luxembourg Industrial 4.38 05/04/13 Ba1 0.56 COGNIS GMBH RegS 2.879 09/15/2013 XS0300167938 B1XBH05 99.50 Germany Industrial 2.88 15/09/13 B2 0.56 PHNIX PIB FINANCE BV RegS 9.625 07/15/2014 XS0524563128 B40FJX8 109.27 Netherlands Industrial 9.62 15/07/14 B1 0.56 VALEO MTN 3.75 06/24/2013 FR0010206334 B0BJ005 100.86 France Industrial 3.75 24/06/13 Ba1 0.56 TVN FINANCE CORPORATION PLC RegS 10.75 11/15/2017 XS0466451548 B5MY4N5 113.50 UK Industrial 10.75 15/11/17 B1 0.55 FCE BANK PLC MTN RegS 7.25 07/15/2013 XS0525912522 B44L5D4 106.76 UK Industrial 7.25 15/07/13 Ba2 0.54 LECTA SA MTN RegS 3.524 02/15/2014 XS0285604863 B1QHD13 92.75 Luxembourg Industrial 3.52 15/02/14 B2 0.54 REYNOLDS GROUP RegS 7.75 10/15/2016 XS0463464916 B5960Q9 104.50 United States Industrial 7.75 15/10/16 B1 0.53 CROWN EUROPEAN HOLDINGS SA RegS 7.125 08/15/2018 XS0511127689 B4VGMP3 104.50 France Industrial 7.12 15/08/18 Ba1 0.53 OI EUROPEAN GROUP BV RegS 6.75 09/15/2020 XS0542593792 B3TRYW2 101.25 Netherlands Industrial 6.75 15/09/20 Ba2 0.51 CENTRAL EUROPEAN MEDIA ENTERPRISES RegS 11.625 09/15/2016 XS0452168536 B4LYXV0 100.84 Bermuda Industrial 11.62 15/09/16 NR 0.50 COGNIS GMBH 9.5 05/15/2014 XS0191508281 B0124S0 103.24 Germany Industrial 9.50 15/05/14 Caa2 0.50 DEUTSCHE LUFTHANSA AG 4.625 05/06/2013 DE000A0JQA39 B13TR98 104.30 Germany Industrial 4.62 06/05/13 Ba1 0.50 SEAT PAGINE GIALLE SPA RegS 10.5 01/31/2017 XS0482702395 B3MGTJ8 90.75 Italy Industrial 10.50 31/01/17 B1 0.49 INAER AVIATION FINANCE LTD RegS 9.5 08/01/2017 XS0527885015 B408BP3 102.75 Spain Industrial 9.50 01/08/17 B2 0.49 CAMPOFRIO FOOD GROUP SA RegS 8.25 10/31/2016 XS0461087958 B57J1B2 104.50 Spain Industrial 8.25 31/10/16 B1 0.48 GROHE HOLDING GMBH RegS 8.625 10/01/2014 XS0200848041 B02W0Y7 102.34 Germany Industrial 8.62 01/10/14 Caa1 0.48 VERSATEL AG RegS 3.629 06/15/2014 XS0306628651 B1YYP87 89.53 Germany Industrial 3.63 15/06/14 B3 0.48 REYNOLDS GROUP 8 12/15/2016 XS0307398502 B1Z6J35 98.75 United States Industrial 8.00 15/12/16 Caa1 0.47 TUI AG 5.125 12/10/2012 XS0237431837 B0SV974 98.50 Germany Industrial 5.12 10/12/12 Caa2 0.47 RHODIA SA RegS 3.735 10/15/2013 XS0270503369 B1FRNH0 99.75 France Industrial 3.74 15/10/13 B1 0.47 NORSKE SKOGINDUSTRIER ASA 7 06/26/2017 XS0307552355 B1Z4GH2 78.00 Norway Industrial 7.00 26/06/17 B2 0.47 HEIDELBERGCEMENT F MTN 6.75 12/15/2015 XS0520759803 B3NHD10 103.98 Netherlands Industrial 6.75 15/12/15 B1 0.46 PEERMONT GLOBAL LTD 7.75 04/30/2014 XS0296654600 B1W6GY8 92.00 South Africa Industrial 7.75 30/04/14 B3 0.46 TEREOS EUROPE RegS 6.375 04/15/2014 XS0295632847 B1VYQW1 102.00 France Industrial 6.38 15/04/14 B1 0.46 ALCATEL LUCENT MTN 6.375 04/07/2014 FR0010070805 B00LPX0 102.00 France Industrial 6.38 07/04/14 B1 0.46 FMG FINANCE PTY LTD RegS 9.75 09/01/2013 XS0265075886 B1CD2C9 121.35 Australia Industrial 9.75 01/09/13 B1 0.46 PEUGEOT SA MTN 5.625 06/29/2015 FR0010915116 B5QGPH8 103.39 France Industrial 5.62 29/06/15 Baa3 0.46 EUROPCAR GROUPE SA RegS 8.125 05/15/2014 XS0254144115 B14X1C0 101.50 France Industrial 8.12 15/05/14 Caa1 0.46 PROSECURE FUNDING LP 4.668 06/30/2016 XS0249466730 B122XG7 90.00 Jersey Financial Institutions 4.67 30/06/16 Ba2 0.46 OBRASCON HUARTE LAIN SA 6.25 05/18/2012 XS0299486745 B1WSDN2 101.39 Spain Industrial 6.25 18/05/12 Ba2 0.46 REYNOLDS GROUP RegS 9.5 06/15/2017 XS0307399062 B1Z6JW4 100.50 Luxembourg Industrial 9.50 15/06/17 Caa1 0.44 BOMBARDIER INC. 4.024 11/15/2013 XS0273978592 B1HCJ08 99.82 Canada Industrial 4.02 15/11/13 Ba2 0.44 SMURFIT KAPPA ACQUISITIONS RegS 7.25 11/15/2017 XS0466370540 B582422 104.50 Ireland Industrial 7.25 15/11/17 Ba2 0.44 NXP BV/NXP FUNDING LLC 8.625 10/15/2015 XS0298437087 B1Y95N7 99.19 Netherlands Industrial 8.62 15/10/15 Caa3 0.42 FAIRFAX MEDIA GROUP FINANCE PTY LT 6.25 06/15/2012 XS0305837527 B1YW0D1 102.12 Australia Industrial 6.25 15/06/12 NR 0.42 KAZKOMMERTS INTERN MTN RegS 6.875 02/13/2017 XS0286431100 B1QHB97 91.50 Kazakhstan Financial Institutions 6.88 13/02/17 Ba3 0.41 INEOS US FINANCE LLC RegS 9.25 05/15/2015 XS0508553764 B3S36Z8 105.50 UK Industrial 9.25 15/05/15 B1 0.41 PE PAPER ESCROW GMBH RegS 11.75 08/01/2014 XS0442348073 B3V54D5 115.50 Austria Industrial 11.75 01/08/14 Ba2 0.40 CEMEX FINANCE LLC MTN RegS 9.625 12/14/2017 XS0473787884 B4YMGR8 95.25 United States Industrial 9.62 14/12/17 NA 0.40 CEDC FINANCE CORPORATION INTERNATI RegS 8.875 12/01/2016 XS0468883672 B4QN6V3 107.50 United States Industrial 8.88 01/12/16 B1 0.40 INTERNATIONAL POWER FINANCE LTD RegS 7.25 05/11/2017 XS0508517611 B42PX34 117.70 UK Utility 7.25 11/05/17 Ba3 0.39 EUROPCAR GROUPE SA RegS 4.399 05/15/2013 XS0254147480 B168800 95.00 France Industrial 4.40 15/05/13 B3 0.39 HEIDELBERGCEMENT AG RegS 8.5 10/31/2019 XS0458685913 B54QYM8 109.15 Germany Industrial 8.50 31/10/19 B1 0.39 LBI ESCROW CORP RegS 8 11/01/2017 XS0498576833 B5BQ1L9 108.00 United States Industrial 8.00 01/11/17 Ba3 0.38 AGROKOR DD RegS 10 12/07/2016 XS0471612076 B4XYR38 107.00 Croatia (Hrvatska Industrial 10.00 07/12/16 B2 0.38 CLONDALKIN ACQUISITION BV RegS 2.879 12/15/2013 XS0305155102 B1YWX76 93.00 Netherlands Industrial 2.88 15/12/13 B1 0.38 LOUIS NO 1 PLC 8.5 12/01/2014 XS0277864640 B1KMV43 89.50 UK Industrial 8.50 01/12/14 Caa2 0.38 HELLA KGAA HUECK & CO RegS 7.25 10/20/2014 XS0454794123 B512DK0 109.50 Germany Industrial 7.25 20/10/14 Ba1 0.38 CIRSA FUNDING LUXEMBOURG SA RegS 8.75 05/15/2018 XS0506591519 B467N69 105.25 Luxembourg Industrial 8.75 15/05/18 B3 0.38 KRONOS INTERNATIONAL INC 6.5 04/15/2013 XS0259658846 B19RX43 99.75 United States Industrial 6.50 15/04/13 Caa1 0.37 PEUGEOT SA 5 10/28/2016 FR0010957282 N/A 99.77 France Industrial 5.00 28/10/16 Baa3 0.37 TELE DANMARK AS 5.875 12/16/2015 XS0473999984 B51GRG6 108.75 Denmark Industrial 5.88 16/12/15 Ba3 0.37 HERTZ HOLDINGS NETHERLANDS B.V RegS 8.5 07/31/2015 XS0522343101 B3X0CG7 105.75 United States Industrial 8.50 31/07/15 B1 0.37 BARRY CALLEBAUT SERVICES NV 6 07/13/2017 BE0933072291 B2336L2 106.50 Belgium Industrial 6.00 13/07/17 Ba1 0.37 RENAULT SA MTN 5.625 03/22/2017 FR0010871541 B3N18C8 103.18 France Industrial 5.62 22/03/17 Ba1 0.37 CEGEDIM SA 7 07/27/2015 FR0010925172 B4LDYC5 104.30 France Industrial 7.00 27/07/15 NR 0.36 LEVI STRAUSS & CO 7.75 05/15/2018 XS0520235218 B4Z2MN5 102.00 United States Industrial 7.75 15/05/18 B2 0.36 CONSOL SPECIALITY MTN RegS 7.625 04/15/2014 XS0294430094 B1VSJV3 99.25 South Africa Industrial 7.62 15/04/14 B1 0.35 GRUPPO EDITORIALE LESPRESSO SPA 5.125 10/27/2014 XS0203341424 B03MKJ1 101.99 Italy Industrial 5.12 27/10/14 NR 0.35 NEXANS SA 5.75 05/02/2017 FR0010465427 B1WLJ11 99.00 France Industrial 5.75 02/05/17 NR 0.35 EC FINANCE PLC RegS 9.75 08/01/2017 XS0521356567 B3TYYM3 108.25 UK Industrial 9.75 01/08/17 B2 0.33 ONO FINANCE II MTN RegS 8 05/16/2014 XS0242754850 B0Y8WM5 93.00 Ireland Industrial 8.00 16/05/14 Caa2 0.33 STENA AB 6.125 02/01/2017 XS0285176458 B1QGRF2 95.00 Sweden Industrial 6.12 01/02/17 Ba3 0.33 OI EUROPEAN GROUP BV 6.875 03/31/2017 XS0291713948 B1V25M8 104.00 Netherlands Industrial 6.88 31/03/17 Ba2 0.32 MAGYAR TELECOM BV RegS 9.5 12/15/2016 XS0473176658 B4XXNN7 99.98 Netherlands Industrial 9.50 15/12/16 B1 0.32 ARDAGH PACKAGING FINANCE PLC 144A 9.25 10/15/2020 XS0547021757 N/A 102.58 Ireland Industrial 9.25 15/10/20 NR 0.32 OXEA (CY S.C.A.) RegS 9.625 07/15/2017 XS0523636594 B432N01 109.26 Germany Industrial 9.62 15/07/17 B2 0.31 EDCON HOLDINGS PTY LTD RegS 6.379 06/15/2015 XS0305313701 B1YN3L3 81.00 South Africa Industrial 6.38 15/06/15 Caa1 0.31 CARLSON WAGONLIT BV RegS 6.649 05/01/2015 XS0273439298 B1GGNN2 96.00 Netherlands Financial Institutions 6.65 01/05/15 Caa2 0.29 LIZ CLAIBORNE INC 5 07/08/2013 XS0260255160 B188LF4 83.00 United States Industrial 5.00 08/07/13 Caa2 0.28 NOVASEP HOLDING S.A.S. RegS 9.625 12/15/2016 XS0473821816 B52K9R2 86.00 France Industrial 9.62 15/12/16 B3 0.27 ABENGOA SA 9.625 02/25/2015 XS0469316458 B4KN2B1 103.98 Spain Industrial 9.62 25/02/15 NA 0.27 CABLECOM LUXEMBOURG SCA RegS 8 11/01/2016 XS0273428416 B1GCZZ6 103.50 Netherlands Industrial 8.00 01/11/16 B2 0.27 GECINA SA MTN 4.875 01/25/2012 FR0010095422 B01HMF8 102.97 France Financial Institutions 4.88 25/01/12 NR 0.26 IMPRESS HOLDINGS BV RegS 9.25 09/15/2014 XS0257947290 B1FH239 104.50 Netherlands Industrial 9.25 15/09/14 B3 0.26 WIENERBERGER AG MTN 4.875 07/07/2014 AT0000A0H999 B56PL99 102.25 Austria Industrial 4.88 07/07/14 Ba1 0.26 NEW WORLD RESOURCES NV RegS 7.375 05/15/2015 XS0300667408 B1XFZS1 100.00 Netherlands Industrial 7.38 15/05/15 B3 0.26 ARDAGH PACKAGING FINANCE PLC 144A 7.375 10/15/2017 XS0547007418 N/A 102.03 Ireland Industrial 7.38 15/10/17 Ba3 0.25 ROHM & HAAS CO 3.5 09/19/2012 XS0230242090 B0LDCN4 99.48 United States Industrial 3.50 19/09/12 Ba1 0.25 NORDIC TELEPHONE C MTN RegS 6.399 05/01/2016 XS0252440010 B13V222 100.12 Denmark Industrial 6.40 01/05/16 B1 0.24 WENDEL 4.875 05/26/2016 XS0253989635 B147434 95.00 France Industrial 4.88 26/05/16 NR 0.24 BCM IRELAND FINANCE LTD RegS 5.899 08/15/2016 XS0264261974 B1BPHP4 55.50 Cayman Islands Industrial 5.90 15/08/16 Caa2 0.21 ARDAGH GLASS FINANCE PLC RegS 9.25 07/01/2016 XS0435914790 B605SG8 109.25 Ireland Industrial 9.25 01/07/16 Ba3 0.21 FRESENIUS US FINANCE II INC RegS 8.75 07/15/2015 XS0390398344 B3L5048 117.21 United States Industrial 8.75 15/07/15 Ba1 0.20 HORNBACH-BAUMARKT-AG RegS 6.125 11/15/2014 XS0205954778 B0422Y9 106.25 Germany Industrial 6.12 15/11/14 Ba3 0.20 ROCKWOOD SPECIALTIES GROUP INC 7.625 11/15/2014 XS0233895415 B0PHHM6 102.38 United States Industrial 7.62 15/11/14 B3 0.20 IKB DEUTSCHE INDUS MTN 4.5 07/09/2013 XS0171797219 7624607 88.75 Germany Financial Institutions 4.50 09/07/13 Ba2 0.20 PERI GMBH RegS 5.625 12/15/2011 XS0207564385 B04SGF6 102.25 Germany Industrial 5.62 15/12/11 Ba1 0.20 FOODCORP LTD RegS 8.875 06/15/2012 XS0222871179 B0BP672 100.90 South Africa Industrial 8.88 15/06/12 B2 0.19 HAPAG-LLOYD AG MTN RegS 9 10/15/2015 XS0545329624 N/A 103.25 Germany Industrial 9.00 15/10/15 B3 0.19 SUNRISE COMMUNICAT MTN RegS 7 12/31/2017 XS0548101723 B4LXC10 103.38 Luxembourg Industrial 7.00 31/12/17 NR 0.19 TRW AUTOMOTIVE INC RegS 6.375 03/15/2014 XS0292580742 B1VK4C5 102.50 United States Industrial 6.38 15/03/14 B2 0.18 FMC FINANCE VI S.A. 5.5 07/15/2016 XS0477568637 B61P566 105.75 Luxembourg Industrial 5.50 15/07/16 NR 0.13 RENAULT SA MTN 5.625 06/30/2015 FR0010944769 N/A 103.85 France Industrial 5.62 30/06/15 NR 0.13 ZIGGO FINANCE BV 144A 6.125 11/15/2017 XS0552327685 N/A 100.00 Netherlands Industrial 6.12 15/11/17 Ba2 0.12 ARDAGH GLASS FINANCE BV RegS 7.125 06/15/2017 XS0304675159 B1YCS48 93.50 Ireland Industrial 7.12 15/06/17 B3 0.10 PICARD BONDCO SA 144A 9 10/01/2018 XS0544396368 B400XD1 103.12 France Industrial 9.00 01/10/18 B3 0.10 CONTI-GUMMI FINANCE BV 6.5 01/15/2016 DE000A1A1P17 B4PHN82 100.85 Netherlands Industrial 6.50 15/01/16 B1 0.06 NARA CABLE FUNDING LIMITED RegS 8.875 12/01/2018 XS0550774870 B4PFRR3 100.23 Ireland Industrial 8.88 01/12/18 B2
This file represents fund portfolio holdings. The actual holdings of the fund may differ.


© 2010BlackRock Advisors (UK) Limited. All rights reserved.


ntpagetag.gif
 
il consumatore americano si sta risvegliando:

U.S. Economy Grew 2% as Consumer Spending Rises


Treasury 30-year bond yields climbed the most in 10 months in October as U.S. securities fell amid speculation that asset purchases by the Federal Reserve will reignite inflation.
The gap in yields on 30-year Treasury Inflation Protected Securities and comparable U.S. bonds, the breakeven rate that indicates trader expectations for prices over the life of the securities, widened yesterday to the most in five months. A sale of five-year TIPS this week drew the first negative yield at a U.S. debt offering as investors speculated returns will be positive when inflation rises. The Fed meets Nov. 2-3.
“People generally don’t want to fight the Fed,” said Suvrat Prakash, an interest-rate strategist in New York at BNP Paribas Securities Corp., one of 18 primary dealers that trade with the central bank. “One area you really don’t want to fight the Fed is TIPS breakevens.”
The yield on the 30-year Treasury bond rose 30 basis points, or 0.30 percentage point, to 3.99 percent, from 3.69 percent on Sept. 30, according to BGCantor Market Data. The 3.875 percent security due in August 2040 dropped 5 9/32, or $52.81 per $1,000 face value to 98 2/32.
Ten-year Treasury yields rose nine basis points to 2.6 percent, from 2.51 percent at the end of last month. They rose for six straight days through Oct. 27 as the securities slid for the longest period since October 2008. Yields on seven-year debt fell two basis points to 1.89 percent.
First Drop Since March
Treasuries overall lost investors 0.4 percent through Oct. 28, the first monthly decline since a 0.9 percent drop in March, Bank of America Merrill Lynch indexes showed. They’re up 8.3 percent in 2010, reflecting demand for the relative safety of government debt as the U.S. economic recovery faltered. The Standard & Poor’s 500 Index rose 6.1 percent this month.
Thirty-year bonds pared their monthly loss yesterday after primary dealer Goldman Sachs Group Inc. said any so-called quantitative easing by the Fed to spur the economy would likely include purchases of the maturity.
Data yesterday showed the Fed’s preferred inflation measure rose less than forecast, adding to speculation policy makers will boost asset purchases. The price gauge, a measure of personal consumption that strips out food and energy costs, rose at a 0.8 percent annual pace in the third quarter, less than the 1 percent median forecast in a Bloomberg News survey, according to Commerce Department figures.
U.S. gross domestic product increased at a 2 percent annual rate from July through September, in line with economists’ forecasts, Commerce Department data showed. The pace was 1.7 percent in the second quarter and 3.7 percent in the first.
Inflation ‘Trigger’
“We have softer-than-expected inflation data,” said Dan Mulholland, a Treasury trader in New York at primary dealer Royal Bank of Canada. “The GDP is a positive sign going forward, but inflation data will trigger whether or not the Fed does QE.”
The difference between yields on 30-year bonds and comparable TIPS widened 52 basis points to 2.59 percentage points, the most since May 13. The gap between 10-year notes and TIPS increased 33 basis points this month to 2.15 percentage points, the most since May 18.
“Inflation-linked bonds outperformed nominal Treasuries significantly because of expectations that a fresh round of quantitative easing will lead to inflation,” said Nick Stamenkovic, a fixed-income strategist at RIA Capital Markets Ltd. in Edinburgh.
Negative Yield
A $10 billion auction of five-year TIPS on Oct. 25 drew a yield of minus 0.55 percent. The bid-to-cover ratio, a gauge of demand that compares the amount bid with the amount offered, was 2.84, above the average of 2.38 at the previous 10 auctions of the security.
The U.S. also auctioned $35 billion in two-year debt, $35 billion in five-year securities and $29 billion in seven-year notes this week. The two- and five-year debt sales also had higher-than-average demand amid speculation the Fed’s efforts may not bring the economy back to full speed quickly.
Policy makers will probably announce next week asset purchases at an initial pace of $75 billion to $100 billion a month, strategists at primary dealer Citigroup Inc. including Brett Rose and Joseph Leary wrote in a note. While they forecast $500 billion to $750 billion in buys over six to nine months, they wrote that the central bank is unlikely to commit to a specific time period.
$2 Trillion
Other estimates for the ultimate size of an asset-purchase program range from $1 trillion at Bank of America-Merrill Lynch Global Research to $2 trillion at Goldman Sachs. Economists at both firms said the Fed will likely start by announcing $500 billion next week.
A resumption of asset purchases by policy makers would likely include 30-year Treasury bonds, Goldman Sachs said in a note to clients.
Buying 30-year bonds may cause the difference in yield between them and 10-year Treasuries to narrow, Francesco Gazarelli, a London-based analyst at Goldman Sachs, wrote in an e-mailed note. The gap in yields was 1.38 percentage points yesterday, versus a five-year average of 0.53 percentage point.
“It’s the first time we’re hearing someone voice the opinion publicly that the Fed’s going to have to do something different in terms of QE,” said Gary Pollack, who helps oversee $12 billion as head of fixed-income trading at Deutsche Bank AG’s Private Wealth Management unit in New York. “Goldman’s a respected voice on the street saying the Fed’s going to have to go out to 30s to do something.”
To contact the reporters on this story: Daniel Kruger in New York at [email protected]; Susanne Walker in New York at [email protected]
To contact the editor responsible for this story: Dave Liedtka at [email protected]
 
Quà penso che sia il posto più adatto per parlare un attimo dell'intervento di Imark al meeting almeno per la parte da me ascoltata.

La mia riflessione voleva andare ad intersecare tutti gli indicatori illustrati da Imark che servono per dare una valutazione abbastanza puntuale sul fatto che i mercati obbligazionari sia su livelli di convenienza o meno.

Personalment eritengo che molti degli indicatori attuali difficilmente possano colgiere il momento storico che viviamo in quanto per la prima volta da sempre vi è unamanipolazione a monte del settore, una manipolazione degli interessi del cosidetto risk free ed anche di parte del settore speculativo quale l'MBS che porta la valutazione degli HY su valutazione difficilmente valutabili in quanto per forza influenzate da quelle del risk free che non è su valori cosidetti "naturali".

In questo contesto occorre piu che affidarsi a degli indicatori standard andare un po più a fiuto perchè all'interno di territori inesplorati con i rischi che ne conseguono. ;)
 
indicazione della domanda offerta degli HY al 10 ottobre e nuove emissioni del settore
 

Allegati

  • hydemandsupply.JPG
    hydemandsupply.JPG
    36,7 KB · Visite: 1.122
  • hybonddeals.JPG
    hybonddeals.JPG
    113,6 KB · Visite: 1.103
  • hycouponemission.JPG
    hycouponemission.JPG
    31 KB · Visite: 1.069
goodbye-great-bond-bull-market: Personal Finance News from Yahoo! Finance
Goodbye, Great Bond Bull Market

by Alan Abelson
Monday, November 1, 2010


provided by

Here we are on the eve of an election on which precariously hangs the fate of the nation, if not the universe. We know that because both the contending parties tell us so. We have to own up, though, to some small kernel of doubt, since lo! the many elections we've been witness to over the years were invariably also described as being crucial for the fate of the nation, if not the universe.
More from Barrons.com:

Setting Up for a Year-End Rally

Thumbs Up for Microsoft

RadioShack: Exorcising Its Inner Geek But as someone who staunchly believes in Winston Churchill's conclusion that democracy is the worst political system devised by man except for all the others, the history of this nation compels us to diffidently suggest that truly "crucial" elections have been rare as hen's teeth and the country has survived even the numerous times the populace perversely has chosen to throw rascals in instead of out.
Still, this election, whatever the outcome, does boast a significant distinction from all its midterm predecessors. Not, unfortunately, in the quality of the candidates; they're easily as mediocre or worse a crop as any produced in the past couple of hundred years. But where they truly stand out is in the enormous sums raised on behalf of their candidacies. As Will Rogers put it so aptly, "politics have gotten so expensive that it takes lots of money even to get beat."
According to the Center for Responsive Politics (that name seems like a contradiction in terms), which has been keeping track of this sort of thing for over a quarter of a century, when the dust settles and the final tally is in, something close to $4 billion will have been spent, a billion more than in 2006, the previous high for a midterm contest. Now, we realize that with Uncle Sam routinely running trillion-dollar-plus deficits, $4 billion can seem like chump change. But it strikes us as quite a bundle just to decide which chumps get the privilege of messing things up for the next two years.
As Bill Gross, boss man at Pimco, one smart guy, a treasured Roundtable member, who, after three fruitful decades in the investment trenches, knows everything worth knowing about fixed-income securities in particular and the perils and rewards of markets over all, grouses in his latest commentary: "Democrat or Republican, Elephant or Donkey, nothing much ever seems to change." Either party, he allows, has no trouble fecklessly adding hundreds of billions of bucks to the national debt.
Bill's normally the soul of equanimity, but what's got his dander up is the fearsome bind our improvident politicos have put us in. That particular bind, in his view, comes in the form of a "liquidity trap," in which neither rock-bottom interest rates nor even trillions of quantitative easing may stimulate borrowing or lending because of the conspicuous absence of consumer demand.
That Ben Bernanke can, either by writing checks—Bill's description of monetary easing, good old QE—or similar monetary exertions, get us out of the trap, stacks up as a long way from being a sure thing. And the likely launching of QE2 on Wednesday obviously exacerbates his concerns and endows them with urgency.
"Check writing in the trillions is not a bondholder's friend," he declares; "it is, in fact, inflationary and, if truth be told, somewhat of a Ponzi scheme." It may provide a temporary lift by raising bond prices but, ultimately, it "reaches a dead end where those prices no longer go up" and the investor is prey to inflation and negative real interest rates.
Say goodbye, then, to the great 30-year bull market in bonds. In the event, stockholders also face a dismal fate, though their ability to adjust somewhat to rising inflation could provide a bit of a cushion. And managers of both bond and equity portfolios will have to cope with a very different and not exactly salubrious environment.
Bill vows he has no intention sitting around and howling at the moon. Instead, he's putting his expertise, ground in 35 years of experience, to good purpose. More specifically, he plans to pursue what he calls "safe-spreads": investing in developing/emerging debt with higher yields and non-dollar denominations; high-quality corporate bonds and even U.S. agency mortgages yielding 200 basis more than Treasuries.
The kind of approach may not yield the outsize returns that bond and stock investors have grown accustomed to. But it promises to enable him—and his investors—to sleep soundly at night, with all the benign implications that holds for the nurturing and care of their nest eggs.
As we've tried to stress, Bill Gross is not akin to one of those hyperventilating, wild-eyed bloggers who in an earlier incarnation before the advent of the Internet indulged their mordant view of Homo sapiens by walking around with sandwich signs proclaiming the end of the world is near, and now send out daily bulletins prophesying that something even worse—the end of the stock market—is near.
There is a tendency, we can attest, for even folks with decent haircuts and clean fingernails to label anyone expressing an occasional skeptical sentiment about the investment outlook as an irredeemable misanthrope or, at the very least, a chronic spoilsport. No doubt Bill, who calls them as he sees them, has had to field a few such accusations and, for that matter, hard as it may be to believe, given our perennially sunny perspective, so have we.
This is our way of backing into a less than upbeat analysis of the gross-domestic-product report for the third quarter, released on Friday. On the surface, the economy's performance was unexciting, but about in line with what the Street expected. Beneath the surface, it was even more unexciting.
There were, to be sure, a few more signs of life among consumers, who upped their spending by 2.6%, compared with 2.2% in the previous quarter, but not nearly enough to goose the economy sufficiently to make a dent in that stubbornly high unemployment rate. Capital investment continued to rise, but at a more subdued pace.
As the estimable Dean Baker of the Center for Economic and Policy Research observes, the big boost to July-September GDP came from a $115.9 billion rise in inventories, the largest increase in inventories since the $117.2 billion gain in the first quarter of 1998. Alas, as Dean also points out, the improvement in final demand, which has averaged a pallid 1% in the five quarters since the official end of the recession, was a skimpy 0.6% in the latest three months.
All of which means the great inventory build is odds-on to lose momentum (if you'll pardon the expression) in the months ahead. As Dean observes "this report suggests a picture of an economy that may be skirting zero growth in the next two quarters."
Even if, as we believe, the economy will muddle through, it'll be at a pace that will hardly satisfy Wall Street's expectations as evidenced in the market's increasing frothiness. At the risk of being endlessly repetitive, not to say unrelentingly pessimistic, we don't quite grasp how the market is supposed to go racing merrily higher in the face of a limp recovery, with the consumer still weighed down by debt and still scared silly of losing his house and/or his job.
Intimations of the investor euphoria that prompted the allusion to market frothiness are scrawled all over the latest sentiment readings. They may not yet have reached those giddy heights that are a clear sign we're headed for trouble, but they're plain enough to warrant a bit of a shiver. The latest Investors Intelligence sounding of advisory sentiment showed a heavy preponderance of bulls—45.6%, to be precise—compared with a scant 20% of bears. The remaining 30% were on the fence but tend to be leaning to the bullish side.
Typically, the more optimistic these pros are, the more likely the market's headed for a fall, while the more bearish their outlook, the more likely the market's due to rise. They are, in short, consummate contrarian indicators.
The same pretty much holds true for the small investor. And the collective sentiment of this group, which tends in any case to be quite mercurial, at the moment is even more perturbing. According to the American Association of Individual Investors, which routinely polls its members on how they feel about the market, 51.2% of them are bullish and a mere 21.6% bearish. The rest are listed as "neutral" (whatever that means).
Sentiment flops around for the most part in line with market performance. And like every other device that purports to predict the future, it's scarcely fool-proof. But when it's so emphatically bullish or bearish as the latest numbers suggest, it's a good bet it's primed to move in the opposite direction.
This week shapes up as a lulu. Besides the election on Tuesday, the Federal Reserve's Open Market Committee gathers the day after to end the suspense on QE2 (and start planning, we'd guess, for QE3), and Friday brings the October jobs report.
For guidance on what that report might look like we turned to John Williams of Shadow Government Statistics. John, you remember, was right on the money with his forecast for the September numbers, so we figured we'd try catching lightning twice.
The consensus, he relates, is for 45,000 additions to payroll and the unemployment rate to remain at 9.6%. His prediction: a contraction in payrolls, a higher jobless rate and rises in the broader unemployment measures. If he's on the money, remember you read it here first. If, by chance, he isn't, be nice and don't remember.
 
Quà penso che sia il posto più adatto per parlare un attimo dell'intervento di Imark al meeting almeno per la parte da me ascoltata.

La mia riflessione voleva andare ad intersecare tutti gli indicatori illustrati da Imark che servono per dare una valutazione abbastanza puntuale sul fatto che i mercati obbligazionari sia su livelli di convenienza o meno.

Personalment eritengo che molti degli indicatori attuali difficilmente possano colgiere il momento storico che viviamo in quanto per la prima volta da sempre vi è unamanipolazione a monte del settore, una manipolazione degli interessi del cosidetto risk free ed anche di parte del settore speculativo quale l'MBS che porta la valutazione degli HY su valutazione difficilmente valutabili in quanto per forza influenzate da quelle del risk free che non è su valori cosidetti "naturali".

In questo contesto occorre piu che affidarsi a degli indicatori standard andare un po più a fiuto perchè all'interno di territori inesplorati con i rischi che ne conseguono. ;)

Caro Gipa, sulle mappe romane, in corrispondenza dei territori inesplorati, ci scrivevano "hic sunt leones", non senza qualche buona ragione, a significare che dove ci sono i leoni è opportuno muoversi con estrema prudenza... ;)

Poi non è detto che acquistando HY oggi non si riescano a fare gain di trading: d'altronde, anche chi, a suo tempo, ha acquistato titoli azionari della new economy in collocamento e li ha rivenduti facendo attenzione a non mettere nel cassetto alcuna di quelle prelibatezze, i gain li ha fatti, eccome...

Talvolta li ha fatti anche chi li ha tenuti in portafoglio per qualche mese...

Ad un amico commercialista che prese quote in in fondo azionario investito in new economy, e che per alcuni mesi si giovò dell'ultima parte della salita dei titoli ai tempi belli della bolla, chiesi se non trovasse nulla di insensato in valutazioni che a me (che mi arrabatto in una lettura superficiale dei bilanci) parevano lunari.

E lui mi rispose che era vero quanto dicevo, ma che in finanza non contano i bilanci, bensì le prospettive... invecchiando, mi vado convincendo che chi rimase impelagato nello scoppio della bolla dei titoli della radiofonia USA (la new economy dell'epoca) a fine anni '20 del secolo scorso deve aver pensato la stessa cosa... :lol: :lol:

Il tempo fu galantuomo in entrambe le circostanze, così come lo è stato nell'evidenziare la sensatezza della risposta data da Greenspan a chi (mi pare fossimo a fine 2006) gli chiedeva se l'immobiliare USA fosse "a bolla", ricevendo come risposta un'assoluta smentita.

"Nessuna bolla, tutt'al più, in qualche parte degli USA, un po' di schiuma" disse Greenspan.

Si era in territorio inesplorato anche allora, con una caccia al rendimento scatenata dai tassi all'1% che trovò il proprio sbocco ultimo nelle obbligazioni strutturate correlate ai mutui immobiliari USA (residenziali e commerciali) piuttosto che in quelle frutto di altre tipologie di cartolarizzazione.

L'epilogo lo conosciamo tutti, ma ancora a fine 2006 l'affermazione di Greenspan poteva restare discutibile, mancando "la prova provata" del contrario di quanto affermava lui.

Oggi, con i tassi USA a zero da quasi un paio di anni e l'immobiliare fuori gioco, la caccia al rendimento si è senz'altro spostata, fra l'altro, sul corporate HY.

Le agenzie di rating ti fanno notare che siamo ancora un po' al di sopra della media storica ventennale del differenziale di rendimento fra titoli sicuri ed HY.

Circostanza senz'altro vera, sebbene nessuno ritenga di doversi soffermare sull'aspetto per cui il rendimento dei titoli safe è a propria volta sui minimi storici assoluti, e dunque - in assoluto - mai prima d'ora il rischio default di un'emittente corporate HY (valutato in termini percentuali a 5 anni: ad es. stimato pari al 25% in 5 anni per un bond di classe "B") è stato pagato così poco.

Allora, vuoi che si sia alle soglie di un lungo periodo di stagnazione economica, moderatamente deflazionistica, vuoi che invece si sia prossimi ad una discreta ripartenza del ciclo economico, che si sta cercando di inflazionare, resta il dato di fatto che l'HY soffrirà in entrambi i contesti quando si parte da soglie di rendimento così basse, senza contare che di "mine debitorie vaganti" ne girano parecchie.

La Grecia è stata temporaneamente disinnescata, Dubai prima della Grecia, e l'Irlanda si scorge in prospettiva, insieme con le regioni autonome spagnole (chi legge qui non avrà avuto bisogno di apprendere dal Sole 24 Ore della emissione dei bond "patriottici" di una Catalogna con un deficit/PIL attorno al 20% ed un debito lanciato verso il traguardo del 200% a fine anno prossimo) e si vedrà cosa si riesce a fare.

Ma dato che l'ottimismo è il profumo della vita, ammettiamo pure che queste ed altre vicende che magari sono in incubazione e non sotto i riflettori dei media (immobiliare cinese ?) siano tutte tenute sotto controllo per qualche anno almeno.

Lo stato dell'arte resta quello descritto in questo breve report di Moody's di qualceh giorna fa, intitolato "Quest for Yield Assigns Rich Values to Riskiest High Yield Debt"...

Passaggio chiave questo:

....

The average high yield bond spread of 576 bp on October 19 represents a significant narrowing from August 31’s three-month high of 658 bp that held before the FOMC affirmed its commitment to combat deflation.
But the recent average still stands above the twenty-year median high yield spread of 468 bp, as confidence in speculative grade debt is not fully restored.

A more optimistic development is the improvement in Caa rated spreads relative to the rest of the high yield market. On October 19, the 725 bp median spread for US domiciled Caa rated issuers stood only 147 bp above the B rated median and 257 bp above the Ba rated median (Figure 1). Over the past five years the Caa to B and Caa to Ba gaps held wider median values of 292 bp and 400 bp, respectively.

...

In soldoni, le aspettative del mercato in merito al secondo quantitative easing della FED hanno spinto ai minimi il differenziale di rendimento fra bond di classe CCC (50% probabilità di default a 5 anni) e bond di classe "B" e di classe "BB". Tale spread non era stato quasi mai così basso neanche ai tempi della bolla recente, quella scoppiata nel 2007-2008.

Queste ultimi due classi di bond erano evidentemente avvertite come "troppo sicure" per generare accettabili ritorni in conto capitale sull'investimento, e si è preferito scavalcarle puntando direttamente sul pattume più tossico dell'obbligazionario corporate HY, confidando che questo sarà maggiormente premiato dall'operazione della FED.

Ora, giova ricordare che le classi di rating sotto la "CCC", ossia la "CC" e la "C", sono adoperate per segnalare rischio di default imminente, ossia assegnate ad emittenti per i quali non si sa se di qui a 1 mese saranno in grado di evitare il default.

Insomma, sotto la "CCC" non c'è niente e l'attuale scommessa dei mercati è estrema.

A me pare si possa chiamare il bottom di rendimento per il ciclo dell'HY.

Poi, che su questo bottom si stazioni 1 mese, o piuttosto 3 mesi, o invece 6 mesi, o addirittura di più, questo non sono in grado di dirlo, non disponendo della sfera di cristallo... ;)

Di mio, avevo pensato che la vicenda greca valesse a segnare un punto di arrivo. Prendo atto invece che l'orchestrina ha deciso di suonare ancora un valzer. D'altronde, l'inclinazione del ponte del Titanic consente ancora ai passeggeri di ballare, e allora, perché affrettarsi alle scialuppe ? :lol: :lol:

Il report di Moody's con interessanti valutazioni sul risk/reward dei bond HY più speculativi se stimato in considerazione dei default attesi a 12 mesi.
 

Allegati

A me sembra che in gandi linee tutti i poteri forti siano d' accordo a " non alzare il tappeto ..." perche' non si sa' quello che ci si trova sotto ( o almeno in grandi linee si sa' cosa ci si trova ma e' meglio non vedere ) et a rimandare e rimandare , sperando che col tempo si ripulisca quello che sta sotto il tappeto senza troppi drammi e speriamo che vada cosi' che la Lehman a me e' bastata. Comunque , per me' , siamo alla fine di un ciclo dove Ci , (intendo europa/usa) , siamo spesi e finiti l' eredita' e ci siamo indebitati fino al collo e camminiamo sul filo del rasoio per cui e' bene navigare a vista .;)
 
da iShares comunicano che...

L'ETF iShares Markit iBoxx Euro High Yield, il primo ETF ad alto rendimento in euro a livello globale, ha ora superato i 150 milioni di euro in attivi gestiti, dopo solo 7 settimane dal lancio
 

Users who are viewing this thread

Back
Alto