luigileo
Forumer storico
eh giàma perché non investi 100.000 euro alla volta allora?
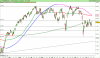
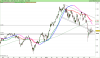
notare la precisione sotto
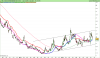
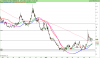
la linea è volutamente tracciata così sul giornaliero e notare come si comporta sull'orario
Vedi l'allegato 343162
Vedi l'allegato 343163

100.000 euro. ....diviso 5. ...hobby. ....
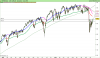
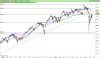
 ......nel frattempo daily millimetrico oggi sulla mm200.....banks negativo ma sempre sopra......incredibile l'indecisione che si sta creando in attesa di fomc e tre streghe.....