Stai usando un browser molto obsoleto. Puoi incorrere in problemi di visualizzazione di questo e altri siti oltre che in problemi di sicurezza. . Dovresti aggiornarlo oppure usarne uno alternativo, moderno e sicuro.
Indici ItaliaApprofondimenti di Analisi Ciclica con Fourier e MiB
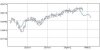
Bisogna, secondo me, stare attenti anche all'€/$.
La sua repentina discesa è coincisa con l'arrivo degli acquisti da noi.
Magari a qualcuno non stava bene il cambio prima.
ciao hal
interessante l'extrapolator, lo sto cercando per metastock
ho trovato quello per MT4 il sorgente è davvero per me troppo complesso (per metastock mi piacerebbe ), qui c'è il sorgente.
Method 1: Fourier's extrapolation; the frequencies are calculated using the Quinn-Fernandes Algorithm
Method 2: Autocorrelation Method
Method 3: Weighted Burg Method
Method 4: Burg Method with Helme-Nikias weighting function
Method 5: Itakura-Saito (geometric) method
Method 6: Modified covariance method
Methods 2-6 are the methods of linear prediction. The linear prediction is based on finding the future values as the linear functions of the past values. Assume that we have a number of prices x[0]..x[n-1] where the higher index is compliant with the recent price. The prediction of the future price x[n] is calculated as
x[n] = -Sum(a*x[n-i], i=1..p)
where a[i=1..p] - coefficients of the model, p - order of the model. The listed methods 2-6 find the coefficients a[] by decreasing the mean-root-square error on the training last n-p bars. Of course, we can reach the zero error of prediction if we directly solve the set of equations mentioned above with n=2*p by the Levinson-Durbin method. Such method of prediction is called Prony Method. Its disadvantage is the instability during the prediction of the future values of the series. That's way this method has not been included.
The other input parameters are:
LastBar - the number of the last bar in the past data
PastBars - the number of past bars used for the prediction of the future values
LPOrder - the order of the linear model as a fraction from the number of the past bars (0..1)
FutBars - the number of future bars in the prediction
HarmNo - the maximum number of frequencies for the Method 1 (0 means all frequencies)
FreqTOL - the imprecision of the frequeincies calculation for the Method 1 (if it is >0.001 it can't converge)
BurgWin - the number of the weighting function for the Method 2 (0=Rectangular 1=Hamming 2=Parabolic)
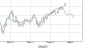
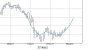
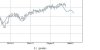
The indicator draws two lines: the blue line shows the prices of the model on the training bars, the red line shows the predicted future prices.
Trading strategy:
But keep in mind that this is just a forecast and not an entry signal. That is why I plot on the chart another indicator that is giving trading directionnal signal.
On the lowest window there is the iVAR (You can also use the FGDI). This is a fracal dimension index. The neural net is having better chance to give a precise forecast when you ask it when the fractal dimension is low.
Così come rappresentata graficamente.
Fatemi sapere se ho sbagliato qualcosa...
Ovviamente tutto ciò è a titolo amatoriale, senza nessuna pretesa di previsione. Sconsiglio vivamente, anzi, di prendere questo post a base per qualsiasi valutazione di investimento.