solomare
APPRENDISTA TRADER
hahahahahahahhaah mica è così facile .ocioChe devo convertire...sono loro che sono dei coglioni...facevano un bel minimo intorno ai 1000 (ora dubito che lo faranno anche se c'è tempo ancora)e poi si saliva belli e pimpanti fino a fine anno,così invece fanno gli stronzi e si condannano.Se questa è la A che hanno fatto,ho la C a 745 (261,8).Contenti loro
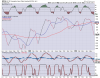
cmq ancora non abbiamo risolto nulla ma sopra 1090 ci siamo andati ora resistenza indice 1107 (questi sono future plottati nei nell'indice )
ma per me conta molto come conteggio 1116 un close sopra mi porta ad un target minimo posto fra 1136/1157 che poi target e SHS orario
li avremo idee chiare se B O 2