“We can now restrict market extremes matching the present instance to seven instances in history: 1929 (at least on the basis of imputed sentiment data), 1972, 1987, 2000, 2007, 2011, and today.
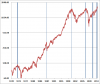
The blue lines on the chart below identify each point in history where the following overvalued, overbought, over bullish, rising yields syndrome would have been observed: S&P 500 overvalued with the Shiller P/E (the ratio of the S&P 500 to the 10-year average of inflation-adjusted earnings) greater than 18; overbought within 3% of its upper Bollinger band (2 standard deviations above the 20-period average) at daily, weekly, and monthly resolutions, more than 7% above its 52-week smoothing, and more than 50% above its 4-year low; over bullish with the 2-week average of advisory bullishness greater than 52% and bearishness below 28%; and yields rising with the 10-year Treasury bond yield higher than 6-months earlier. August 1929 can also be included, given that we can impute bullish/bearish sentiment with reasonable accuracy based on the size and volatility of prior market movements.The market lost 85% between 1929-1932, lost over 50% between 1972-1974, crashed abruptly in 1987, lost over 50% in 2000-2002 and again between 2007-2009, and even lost nearly 20% in the less-memorable 2011 instance
Note that the foregoing negative conditions were repeated in May, and just missed another repeat last week (the 2-week average of bullish sentiment reached 51.8 – the difference being insignificant in that using a 51.8 threshold would not have added or removed any of the prior historical instances).
As I’ve noted before, these syndromes look fairly precise on a long-term chart, but these charts actually compress months and months of market churning into a very small area, making it very easy to get lost in smaller fluctuations and apparent ‘resilience’ of the market when you actually live through these periods day-to-day. Needless to say, my concerns about this strenuously overvalued, overbought, over bullish, rising-yield syndrome have not been useful or relevant in recent months, as the market has advanced to further highs. As a result of that advance, our estimates of 10-year prospective S&P 500 nominal total returns have deteriorated further – from 3.8% annually in January to just 2.8% today.”“Still, we know that the same strenuously overvalued, overbought, over bullish syndrome observed in 1972, 1987, 2000, 2007 and even 1929 (on imputed sentiment data) is already in place here, and that the losses from such extremes have been spectacular. We invest on objective evidence that we can test over a century of market cycles. In recent years, we’ve incorporated a number of useful considerations into our approach – particularly related to trend-sensitive measures – that can be validated over history. But history leaves us with little faith that even aggressive Fed action can prevent steep market losses in the absence of supports that have presently dropped away. Investors who wish to try their luck and rest their security on the Fed can certainly do so without our permission or agreement.”
“We have been riding a dangerously overextended set of conditions for quite a while now, and the retreat from similar extensions has always been unpleasant. Just like 1929, and 1972, and 1987, and 2000, and 2007, and even the truncated 2011 instance (which was followed by a decline of only about 19%), it’s unlikely that investors who enjoy the thrill of owning stocks at the market’s highs will actually realize the gains by selling at those levels.
Cercano analogie con il passato e ogni volta vengono smentiti dal mercato
")